Video Tour
3D Tour


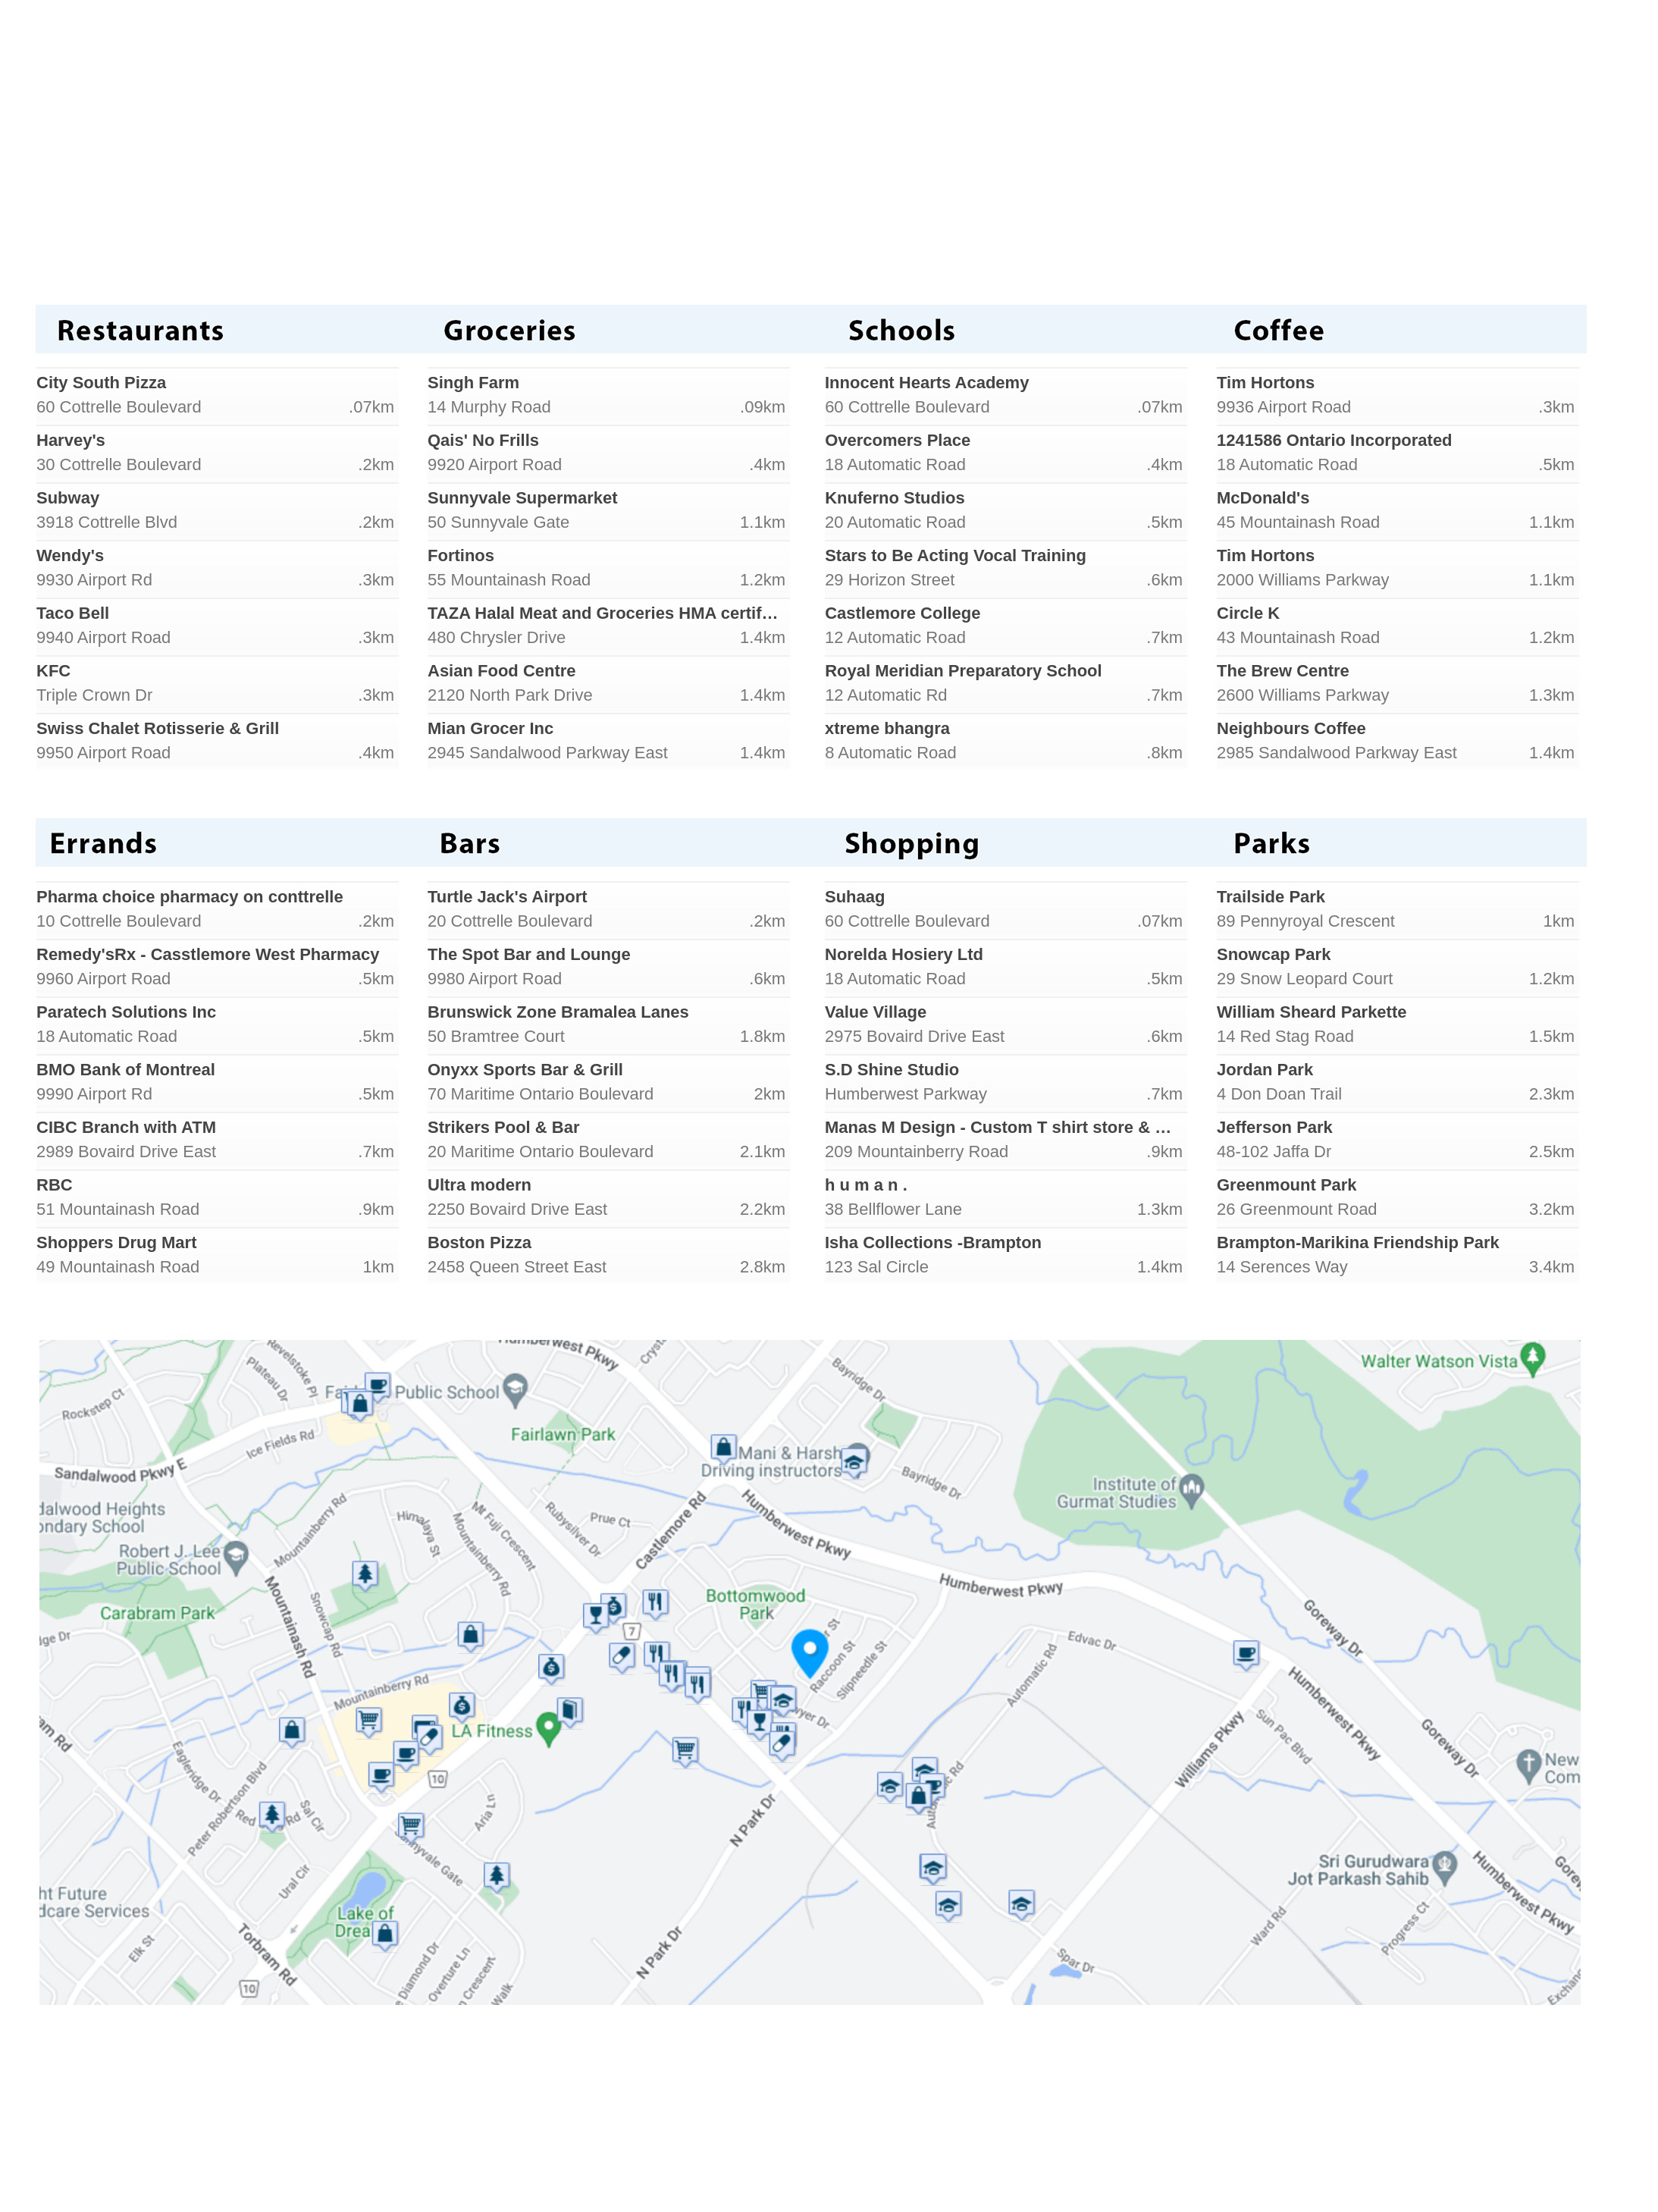
Local Amenities


- BarsBorderline Sports Bar Jerk Pit Corner0.47Km
- ShoppingSuhaag One Stop Shop Inc0.12Km
- EntertainmentSigma Rockets1.16Km
- ErrandsPharmacy on Cottrelle0.24Km
- CoffeeTim Hortons0.32Km
- ParksTrailside Park1.05Km
- GroceriesGolden Groceries0.23Km
- SchoolsRoyal Meridian Preparatory School0.54Km
- RestaurantsMy Mom's Rasoi0.12Km
- Borderline Sports Bar Jerk Pit Corner18 Automatic Rd0.47Km
- The Spot Bar and Lounge9980 Airport Road0.6Km
- Castle Sports Bar & Grill9980 Airport Rd0.62Km
- Bombay Spice Restaurant and Ba Restaurant And Bar Inc1098 Peter Robertson Blvd1.78Km
- Brampton Winery1650 Williams Pky1.85Km
- Onyxx Sports Bar & Grill17 Maritime Blvd2.02Km
- Strikers Pool & Bar20 Maritime Ontario Blvd2.07Km
- Kelsey's2870 Queen Street East2.53Km
- Secrets Lounge3 Gateway Blvd2.89Km
- La Pergola Ristorante45 Coventry Road3.02Km
- J.M. Dance26 Havenbrook Crt3.68Km
- Natinal Scorpion67 Louvain Dr3.95Km
- Oscar's Roadhouse1785 Queen St E3.96Km
- The Clock on Queen - Public house1775 Queen Street East4.07Km
- Pro Sports Bar & Restaurant630 Peter Robertson Boulevard4.2Km
- Oasis Sports Bar630 Peter Robertson Blvd4.26Km
- Kool Dayz1701 Queen St E4.31Km
- Tech Comforts7089 Torbram Rd4.49Km
- Island Style Restaurant8907 The Gore Road4.54Km
- Island Grove Roti & Bar4525 Ebenezer Road4.54Km
- Rejeanne's Bar & Grill700 Balmoral Dr4.55Km
- Gold Lakes Delight700 Balmoral Dr4.56Km
- On The Rocks Bar & Grill8887 The Gore Road4.56Km
- Wine Kitz117 Nuffield St5.03Km
- The Govnors Pub10 Bramhurst Avenue5.09Km
- All Stars Bar & Grill14 Lisa St5.37Km
- Walkers Brew14 Lisa Street5.44Km
- Garden Grille and Bar2648 Steeles Ave E5.48Km
- Larry's bar and lounge351 Parkhurst Square5.48Km
- St. Louis Bar and Grill100 Peel Centre Dr5.5Km
- Clancy's Sports Bar & Grill456 Vodden Street East5.83Km
- Tunup Entertainment73 Bramalea Rd6.09Km
- Jack Astor's Bar & Grill154 West Drive6.09Km
- Allstars Bar & Grill73 Bramalea Road6.13Km
- Allstars Restaurant14 Lisa St6.13Km
- Majestic Billiards Club2074 Steeles Ave E6.18Km
- G T Restaurant Bar2074 Steeles Ave E6.18Km
- Divas Lounge26 Melanie Dr6.19Km
- NINE 1810100 Heart Lake Road North6.25Km
- Latin Quarter2 Melanie Dr6.26Km
- Bavaria Lounge5 Coachworks Cres6.29Km
- Kitty Katz Lounge26 Melanie Dr6.33Km
- Frigate & Firkin378 Queen St E6.65Km
- The Sha's Restaurant3233 Brandon Gate Drive6.74Km
- Up Yer Kilt Pub & Club284 Orenda Road6.75Km
- Kennedy Cafe & Grill220 Wexford Rd7.13Km
- Timeout Sports Pub4025 Brandon Gate Dr7.19Km
- Euro Can Quality Wine1625 Steeles Ave E7.25Km
- Maguires284 Queen St E7.29Km
- Loyal Order of Moose70 Advance Blvd7.32Km
- Wild Wing249 Queen St E7.33Km
- Ta Bar and Grill249A Queen St E7.34Km
- Harry Flashman's249 Queen St W7.35Km
- Keltic Rock Pub & Restaurant180B Sandalwood Pky E7.47Km
- Foxxes Den260 Queen St E7.51Km
- King Tandoori Bar & Grill7600 Hwy 277.56Km
- Duffy's Bar & Grill7600 Hwy 277.56Km
- Azores Club & Bar99 Orenda Road7.58Km
- Eq Lounge Seafood Bar120 Advance Blvd7.59Km
- The Miracle Bar and Lounge120 Advance Blvd7.59Km
- Fusion Cafe164 Sandalwood Pky E7.59Km
- St. Louis Bar and Grill8290 Hwy 277.72Km
- Chamak Steel Railing and Window Bar2500 Williams Pky7.77Km
- Real Authentic Jamaican Restaurant & Bar7385 Torbram Road7.78Km
- 7 Lounge5875 York Regional Road 77.84Km
- Glasgow Rangers Supporters185 Advance Blvd7.85Km
- Rangers Club Brampton185 Advance Blvd7.86Km
- Nw Vinos Inc12 Goodmark Pl7.93Km
- Cabaret Canonball195 Advance Blvd7.94Km
- Tapas Lounge & Wine Bar7 5875 Hwy7.96Km
- Suhaag One Stop Shop Inc60 Cottrelle Blvd0.12Km
- Rhythm Creations60 Cottrelle Boulevard0.13Km
- Karim Jewellers11 Raccoon St0.17Km
- Bhalla Watch House9 Gaspe Rd0.18Km
- Anmol Boutique60 Cottrelle Blvd0.2Km
- Style For You – Online Shopping Store50 Cottrelle Blvd0.2Km
- Memsaab Collection60 Cottrelle Blvd0.2Km
- Janak Jewellers60 Cottrelle Blvd0.22Km
- Da Fashionista40 Murphy Rd0.24Km
- McGregor Clan Clothing9910 Airport Rd0.41Km
- Dubai Jewellers2700 N Park Dr0.42Km
- Dee Apparel20 Horizon0.55Km
- Norelda Hosiery Ltd18 Automatic Road0.83Km
- Jain Fashions2051 Williams Pkwy1.05Km
- Kurta Club233 Mountainberry Rd1.08Km
- Ashvina Gold Importers2131 Williams Pkwy1.12Km
- Joe Fresh55 Mountainash Rd1.24Km
- Save Hut55 Mountainash Rd1.27Km
- 9 Ratna Jewels51 Mountainash Rd1.29Km
- Master Jewellers | Best Indian Gold & Diamond Jewellery Store in Brampton51 Mountainash Rd1.29Km
- Mark's Work Wearhouse5 Ward Rd1.38Km
- Wolverine World Wide Inc5 Ward Rd1.44Km
- Sai Vachan Creations Inc2120 N Park Dr1.48Km
- Ekam Jewellers2120 N Park Dr1.49Km
- Nanak Jewellers Ltd2955 Sandalwood Pkwy E1.49Km
- Karebear Playland2120 N Park Dr1.58Km
- Brampton T-Shirt Place2120 North Park Drive1.6Km
- 1313 Fashion Accessory31 Quail Feather Cres1.76Km
- Pehnawa The Indian Clothing Ltd1098 Peter Robertson Blvd1.78Km
- India Fashion1098 Peter Robertson Blvd1.78Km
- UK Sweater House1098 Peter Robertson Boulevard1.78Km
- Roop Jewellers Ltd1098 Peter Robertson Blvd1.8Km
- Esprit36 Bramtree Ct1.83Km
- Karol Bagh Jewellers1098 Peter Robertson Blvd1.83Km
- G&K Svc140 Sun Pac Blvd1.85Km
- Ashapuri Gold, Diamond & Silver Jewellers80 Maritime Ontario Blvd1.94Km
- Gold Star Fashion Ltd3 Leone Lane1.98Km
- The Outlet20 Maritime Ontario Blvd2.07Km
- Diamond House Jewellers20 Maritime Ontario Blvd2.07Km
- Wellgroomed Designs Toronto25 Mill St N2.07Km
- Ambika Jewellers2260 Bovaird Dr E2.17Km
- Mehar Boutique39 Rockstep Crt2.18Km
- Roche Diamonds31 Steeplebush Ave2.27Km
- Suhaag Jewellers31 Steeplebush Ave2.33Km
- Brampton Custom T-Shirts & Photo Studio29 Summitridge Court2.41Km
- V F Solutions80 Bramwin Crt2.52Km
- Jewellery & more105 Sunny Meadow Blvd2.56Km
- Clark Packaging Supplies8 Tracey Blvd2.57Km
- Dress Her12 Rufford Drive2.58Km
- Burstein Bag Co8 Tracey Blvd2.62Km
- Wish Wish Wedding Dresses12 Moonland Rd2.63Km
- Carter's - OshKosh B'gosh30 Coventry Rd2.64Km
- Bonnie Togs30 Coventry Rd2.64Km
- Payless ShoeSource30 Coventry Road2.66Km
- Rac Wear Ltd24 Wild Indigo Crescent2.68Km
- Reet Jewellers2710 N Park Dr2.73Km
- Templeofclay45 Timbertop Cres2.73Km
- Columbia Sportswear Co10 Coventry Rd2.77Km
- Wolverine World Wide Inc10 Coventry Rd2.77Km
- The TJX Companies Inc10 Coventry Rd2.77Km
- Mark's Work Wearhouse10 Coventry Rd2.81Km
- Payless ShoeSource30 Coventry Road2.86Km
- Columbia Sportswear Co30 Coventry Rd2.91Km
- Amit Sahdev22 Midnightsun Trail2.93Km
- Paltex Fashions Inc10 Pebblecreek Drive2.94Km
- 416 Decors5 Gateway Blvd2.95Km
- Kim Fashions73 Larkspur Rd2.99Km
- Proper Patola1 Court Dr3.04Km
- Chunri Creations70 Supino Cres3.1Km
- Sia Collection Inc27 Bottlebrush Dr3.11Km
- Ghania's Fashions23 Kettlewell Cres3.14Km
- Diamond Boutique30 Hocken Crt3.14Km
- Eric Design6 Tundra Swan Rd3.18Km
- New Trend Ladies Suits24 Gailwood Crt3.23Km
- Winners Merchants Intl Lp8875 Torbram Rd3.28Km
- 7-Eleven Inc. Canada140 Father Tobin Road3.47Km
- Nanstar Studios4 Moira Creek Dr3.48Km
- Miamitaly Import & Export39 Michelangelo Blvd3.55Km
- Eknoor Fashion Boutique26 Whitehouse Cres3.57Km
- Zakka Canada71 Delta Park Blvd3.64Km
- Somal International Inc26 Bellini Ave3.66Km
- Zevar by Princess Nature86 Avalanche Cres3.7Km
- Mehtaab fashions68 Majestic Cres3.73Km
- Dressing in Style14 Frobischer Dr3.76Km
- Nw Punjab Jewellers20 Dewside Dr3.85Km
- Soul Flexx1785J Queen St W3.94Km
- Shalimar Boutique2510 Countryside Drive3.96Km
- Hira International6 Hapsburg Sq4.01Km
- Nano Text Tiles1055 Clark Blvd4.1Km
- Maple Textiles1055 Clark Blvd4.1Km
- Shaz Collection2 Esplanade Rd4.15Km
- Pehnawa fashion hub63 Black Oak Drive4.17Km
- Aanchal Fashions & Fabrics630 Peter Robertson Blvd4.19Km
- Khoobsurat Klothing8887 the Gore Rd4.2Km
- Padda Fashions50 Lacoste Blvd4.21Km
- Ranin's Fashion41 Seachart Place4.23Km
- Flower Witch131 Ellerslie Rd4.26Km
- Personal Touch Designz24 Tyler Ave4.26Km
- Simply You8550 Airport Rd4.37Km
- Diva Couture8887 the Gore Rd4.42Km
- Siddhnath Collection4535 Ebenezer Road4.45Km
- Royal Sponge Mfg Ltd9 Abacus Rd4.46Km
- Silver Hut4525 Ebenezer Rd4.46Km
- Mona Jewellery8917 The Gore Rd4.48Km
- Bagga Jewellers4525 Ebenezer Rd4.49Km
- Bhalla Watch House8500 Torbram Rd4.5Km
- Vancouver Cloth House4525 Ebenezer Road4.51Km
- Somal Watches Clocks Parts & Tools Supply Ltd30 Intermodal Dr4.54Km
- Somalcanada30 Intermodal Dr4.54Km
- Sukhmani fashion8907 The Gore Road4.54Km
- Zevar Indian Jewellery8887 the Gore Rd4.55Km
- Mohindra's Boutique8887 the Gore Rd4.55Km
- Mausam The Seasons7071 Airport Road4.56Km
- Herz N Hiz Inc4525 Ebenezer Road4.56Km
- SK Punjab Fashion & Jewellery8887 The Gore Road4.56Km
- Palam Boutique8887 The Gore Road4.56Km
- Nu Deep Jewelers8887 the Gore Rd4.58Km
- Brilliant Ideas48 Epsom Downs Dr4.6Km
- Mac's700 Balmoral Drive4.66Km
- A Fair Dollar Store700 Balmoral Drive4.66Km
- Travelfash3 Knightsbridge Rd4.75Km
- Stava's Menswear25 Peel Centre Drive4.78Km
- Moneysworth & Best120 Midair Crt4.81Km
- La Senza25 Peel Centre Dr Brampton4.88Km
- Foot Locker25 Peel Centre Dr4.88Km
- The North Face2512 Central Dr4.89Km
- Bagga8 Gamson Cres4.91Km
- T-Shirt Palace25 Peel Centre Dr4.94Km
- Sigma Rockets2131 Williams Pky1.16Km
- Pbfx27 Hampton Springs Dr3.28Km
- Cineplex Inc50 Great Lakes Dr5.28Km
- SilverCity Brampton Cinemas50 Great Lakes Drive5.28Km
- Cineplex Odeon Corp20 Carleton Pl5.89Km
- WWK Drive-In7855 Finch Ave6.35Km
- Historic Bovaird House.Simmons Boulevard6.91Km
- Felicity Moments Films7497 Wrenwood Cres7.12Km
- Brampton Bowling Center12 Beech St8Km
- Pharmacy on Cottrelle10 Cottrelle Blvd0.24Km
- Scotiabank9919 Airport Rd0.27Km
- I.D.A. - Brampton Lifecare Pharmacy2740 N Park Dr0.31Km
- Paratech Solutions Inc18 Automatic Road0.48Km
- Remedy'sRx - Casstlemore West Pharmacy9960 Airport Road0.52Km
- CMC Pharmacy Inc9960 Airport Rd0.52Km
- BMO Bank of Montreal9990 Airport Rd0.56Km
- CIBC2989 Bovaird Dr E0.72Km
- Frank Brasier & Sons Ltd3 Automatic Rd0.85Km
- Paddon & Yorke Inc2 Automatic Rd0.92Km
- CIBC Cash Dispenser9495 Airport Rd0.97Km
- RBC Royal Bank51 Mountainash Rd0.98Km
- Shoppers Drug Mart49 Mountainash Road1.08Km
- Murale49 Mountainash Rd1.08Km
- Pharmaprix49 Mountainash Rd1.08Km
- Canadian Post49 Mountainash Rd1.08Km
- Biorex Direct2023 Williams Parkway1.09Km
- Scotiabank47 Mountainash Road1.13Km
- Loblaw pharmacy55 Mountainash Road1.14Km
- TD Canada Trust Branch and ATM55 Mountainash Road1.14Km
- Localcoin Bitcoin ATM - Vani's Convenience55 Mountainash Rd1.17Km
- TD Bank Financial Group55 Mountainash Rd1.17Km
- Canadian Institute of Certified Executor Adv isors2131 Williams Pky1.18Km
- Sunnyvale Supermarket50 Sunnyvale Gate1.2Km
- Pharmasave50 Sunnyvale Gate1.24Km
- President's Choice Financial55 Mountainash Road1.27Km
- TD Canada Trust ATM55 Mountainash Rd1.27Km
- Drugstore Pharmacy55 Mountainash Rd1.27Km
- Castlemore Pharmacy2945 Sandalwood Parkway East1.44Km
- CIBC Cash Dispenser2985 Sandalwood Pky E1.45Km
- Pharmachoice2945 Sandalwood Pky E1.45Km
- R B & W Corporation of Canada10 Sun Pac Blvd1.46Km
- Momentum Credit Union Ltd480 Chrysler Dr1.47Km
- Grip Clinch Canada73 Ward Rd1.53Km
- Pharmasave2130 N Park Dr1.57Km
- Culp Ralph9886 Torbram Rd1.64Km
- HODL Bitcoin ATM - North Park Variety9886 Torbram Rd1.67Km
- Vantage Medical Center and Pharmacy9886 Torbram Rd1.67Km
- BMO Bank of Montreal2001 N Park Dr1.7Km
- Scotiabank2001 N Park Dr1.71Km
- Torbram Pharmacy1090 Peter Robertson Boulevard1.81Km
- Localcoin Bitcoin ATM - Convenience Access1650 Williams Pky1.85Km
- Pharmasave Maritime Pharmacy80 Maritime Ontario Blvd1.95Km
- HODL Bitcoin ATM - Kitchen Food Fair65 Braydon Blvd2.03Km
- Pharmasave65 Braydon Blvd2.03Km
- HSBC75 Braydon Blvd2.03Km
- Allkind Insurance Inc20 Maritime Ontario Blvd2.07Km
- Habib Canadian Bank9125 Airport Road2.08Km
- RBC Royal Bank9115 Airport Rd2.09Km
- Canada Post Brampton8495 Goreway Dr2.1Km
- TD Bank Financial Group9085 Airport Rd2.17Km
- TD Canada Trust Branch and ATM9085 Airport Rd2.17Km
- Pharmasave2250 Bovaird Drive East2.26Km
- RBC Royal Bank7 Sunny Meadow Boulevard2.33Km
- CIBC9025 Airport Road2.35Km
- Ultra Med Pharmacy Ltd31 Steeplebush Avenue2.35Km
- Sherwin-Williams9045 Airport Rd2.41Km
- Guardian - Valley Creek Pharmacy1975 Cottrelle Boulevard2.47Km
- Guardians1975 Cottrelle Blvd2.48Km
- Localcoin Bitcoin ATM - JJ's Convenience1975 Cottrelle Blvd2.49Km
- Guardian Pharmacy1975 Cottrelle Blvd2.49Km
- United States Postal Service51 Ashford Crt2.5Km
- Scotiabank1985 Cottrelle Blvd2.52Km
- R B B Investments Ltd2850 Queen St E2.52Km
- Service Canada Centre18 Corporation Drive2.53Km
- Benjamin Moore9960 McVean Dr2.56Km
- RBC Royal Bank9980 Mcvean Dr2.57Km
- Dr. Brampton-Castlemore Rd & Mcvean9980 McVean Dr2.59Km
- BMO Bank of Montreal3550 Queen St E2.6Km
- Northwest Home Hardware205 Delta Park Blvd2.62Km
- Canada Post2937 Queen St E2.63Km
- Compounding Pharmacy9985 McVean Dr2.64Km
- Guardian and I.D.A. Pharmacies10510 Torbram Rd2.66Km
- Guardians10510 Torbram Rd2.66Km
- CIBC Cash Dispenser8980 Goreway Dr2.66Km
- Alterna Savings2909 Queen Street East2.7Km
- Ken Boodhoo - Alterna Savings Credit Union2909 Queen St E2.7Km
- Rona Home & Garden2830 Queen St E2.71Km
- Rexall2100 Bovaird Drive East2.72Km
- Shades of the Six2750 N Park Dr2.74Km
- Pay2Day2456 Queen St E2.74Km
- National Bank10520 Torbram Rd2.76Km
- National Bank Financial10520 Torbram Rd2.76Km
- Banque Nationale du Canada10520 Torbram Rd2.76Km
- MyTech Repair Labs30 Coventry Road2.79Km
- Scotiabank3550 Queen St E2.8Km
- Guardians25 Gateway Blvd2.82Km
- I.D.A. - Gateway Medical Plex Pharmacy25 Gateway Boulevard2.82Km
- Walmart Pharmacy30 Coventry Road2.86Km
- Scotiabank160 Yellow Avens Blvd2.89Km
- TD Bank Financial Group30 Coventry Rd2.91Km
- Healthline Drugstore150 Yellow Avens Blvd2.94Km
- Medisystem Technologies7891 McLaughlin Rd2.94Km
- Insight Digital44 Gulliver Cres2.95Km
- Pan Drugs9025 Torbram Road2.95Km
- Guardian and I.D.A. Pharmacies945 Peter Robertson Rd2.95Km
- Localcoin Bitcoin ATM - Beckers Convenience Store945 Peter Robertson Blvd2.95Km
- Brampton Hospital I.D.A. Pharmacy10095 Bramalea Road2.96Km
- Guardians10095 Bramalea Rd2.96Km
- Pharmaprix10970 Airport Rd2.99Km
- CIBC Cash Dispenser10115 Bramalea Rd2.99Km
- North Bramalea Pharmacy9780 Bramalea3.03Km
- Bramalea Medical Pharmacy10209 Bramalea Road3.07Km
- Pharma Depot10209 Bramalea Rd3.07Km
- Korzite Coatings Inc4 Groveland Cres3.08Km
- Pharmaprix980 Central Park Dr3.12Km
- Murale980 Central Park Dr3.12Km
- Canadian Post980 Central Park Dr3.12Km
- Shoppers Drug Mart980 Central Park Drive3.13Km
- Central Park Cleaners & Alterations980 Central Park Drive3.14Km
- Hair Locks980 Central Park Drive3.14Km
- Worldwide Tools & Equipment Ltd249 Summerlea Rd3.22Km
- Life Care Medicenter13 Father Tobin Rd3.22Km
- OSprep34 Treeline Blvd3.25Km
- TD Canada Trust Branch and ATM135 Father Tobin Road3.32Km
- Father Tobin Pharmacy105 Father Tobin3.33Km
- BMO Bank of Montreal10575 Bramalea Road3.33Km
- TD Bank Financial Group135 Father Tobin Rd3.34Km
- Guardians105 Father Tobin Rd3.35Km
- Guardian and I.D.A. Pharmacies105 Father Tobin Rd3.35Km
- BMO Bank of Montreal10511 Bramalea Rd3.45Km
- Scotiabank140 Father Tobin Rd3.48Km
- Brampton Discount Pharmacy130 Father Tobin Road3.49Km
- Meridian Credit Union ATM10545 Bramalea Rd3.51Km
- RBC Royal Bank10555 Bramalea Road3.53Km
- Sobeys Pharmacy Airport10970 Airport Road3.55Km
- Shoppers Drug Mart10970 Airport Rd3.58Km
- Canadian Post10970 Airport Rd3.58Km
- Tim Hortons9936 Airport Road0.32Km
- Tim Hortons9960 Airport Rd0.42Km
- Solobar Inc18 Automatic Rd0.53Km
- Araazzurro11 Edvac Dr0.94Km
- Tim Hortons2000 Williams Parkway1.15Km
- The Brew Centre2600 Williams Parkway1.21Km
- Tim Hortons43 Mountainash Road1.23Km
- The Coffee Lounge1090 Peter Robertson Blvd1.81Km
- Country Style3995 Cottrelle Boulevard1.88Km
- Second Cup24 Cosmo Crt2.12Km
- Coffee Time Donuts18 Corporation Dr2.42Km
- Alpha Wolf Coffee2880 Queen St E2.47Km
- Tim Hortons8720 The Gore Rd2.53Km
- Tim Hortons2963 Queen Street East2.56Km
- Second Cup2925 Queen St E2.66Km
- Express Country Style10510 Torbram Rd2.67Km
- Sockan Cafe10510 Torbram Road2.69Km
- Williams Coffee Pub2454 Queen St E2.76Km
- Tim Hortons8970 Goreway Drive2.76Km
- Tim Hortons2100 Bovaird Drive East2.77Km
- Twinings North America Inc1 Gateway Blvd2.82Km
- Starbucks25 Gateway Boulevard2.86Km
- Tim Hortons2400 Queen Street East2.88Km
- Tim Hortons10115 Bramalea Road3Km
- Sipping Pretties176 Sussexvale Dr3.38Km
- Tim Hortons95 Father Tobin Road3.43Km
- Coffee Culture Cafe & Eatery10525 Bramalea Road3.54Km
- Tim Hortons35 Cherrycrest Drive3.69Km
- Medcentra18 Kensington Rd4.32Km
- Tim Hortons620 Peter Robertson Boulevard4.32Km
- Starbucks5 Beaumaris Dr4.37Km
- Tim Hortons2 Intermodal Drive4.5Km
- Garden Street Cafe10 Peel Centre Dr4.57Km
- Tim Hortons8720 The Gore Road4.57Km
- Express Country Style17 Kings Cross Rd4.58Km
- Williams Fresh Cafe150 Central Park Drive4.79Km
- Coffee Time5981 Mayfield Rd4.79Km
- Tim Hortons5 Great Lakes Drive4.92Km
- Tim HortonsMayfield Road4.95Km
- Tim Hortons20 Great Lakes Drive5.07Km
- Starbucks25 Peel Centre Drive5.12Km
- Second Cup Coffee Co. featuring Pinkberry Frozen Yogurt25 Peel Centre Drive5.12Km
- Bubble Tease Inc25 Peel Centre Dr5.13Km
- Out This World25 Peel Centre Dr5.13Km
- Second Cup Coffee Co25 Peel Centre Dr5.16Km
- DAVIDsTEA25 Peel Centre Drive5.16Km
- Teaopia Ltd25 Peel Centre Dr5.17Km
- Tim Hortons5.17Km
- Gourmet Cup25 Peel Centre Dr5.19Km
- Starbucks3995 Cottrelle Boulevard5.21Km
- Starbucks90 Great Lakes Drive5.23Km
- Saint Cinnamon Bake Shoppes25 Peel Centre Dr5.24Km
- Caffe Demetre50 Peel Centre Drive5.26Km
- Kung Fu Tea on Peel50 Peel Centre Dr5.26Km
- First Cup10 N Park Dr5.27Km
- Tim Hortons5085 Mayfield Road5.27Km
- Tim Hortons25 Peel Centre Drive5.29Km
- Fruity Juice Bars Inc25 Peel Centre Dr5.3Km
- Country Style Donuts8155 Torbram Rd5.47Km
- Country Style8155 Torbram Road5.48Km
- Tim Hortons2645 Steeles Avenue East5.63Km
- Personal Service Coffee of Brampton129 East Drive5.87Km
- Tim Hortons6701 Langstaff Rd5.9Km
- Country Style9950 Chinguacousy Rd6.04Km
- Tim Hortons10606 Heart Lake Road6.04Km
- N & N Donut Inc10606 Heart Lake Rd6.04Km
- Tim Hortons7988 Torbram Rd6.05Km
- Tim Hortons152 West Drive6.1Km
- Chatime150 West Drive6.17Km
- Country Style Donuts10111 Heart Lake Road6.2Km
- Cathy's Tea Leaf Readings10 Chipwood Cres6.21Km
- Koala Mini Vending Services Inc150 Clark Blvd6.23Km
- United Restaurants300 Kennedy Rd S6.28Km
- Tim Hortons15 Ace Dr6.29Km
- Personal Service Coffee Of Brampton45 Bramalea6.31Km
- Friends155 Clark Blvd6.31Km
- Cuppa8200 Dixie Rd6.39Km
- Java.Cup8200 Dixie Rd6.39Km
- Cuppa8200 Dixie Rd6.42Km
- Sportsnet Cafe8200 Dixie Rd6.46Km
- Tim Hortons8200 Dixie Rd, Northern Telecom6.52Km
- Tim Hortons281 Richvale Dr S6.55Km
- Java Express110 Claireport Cres6.7Km
- Tim Hortons261 Queen Street East7.03Km
- Tim Hortons7480 Airport Road7.19Km
- Playfair Coffee Distributing1625 Steeles Ave E7.25Km
- Tim Hortons6161 Highway 77.29Km
- Country Style6951 Steeles Avenue West7.31Km
- Tim Hortons225 Vodden St E7.38Km
- Cap's Cafe55 Rutherford Rd S7.41Km
- Chahal Harjinder81 Zenway Blvd7.44Km
- Fusion Cafe164 Sandalwood Parkway East7.46Km
- Club Coffee L.p.101 Claireville Dr7.47Km
- Baker's Dozen Donuts180 Sandalwood Pky E7.48Km
- Espresso Rigs101 Innovation Dr7.51Km
- Fiorucci's6923 Steeles Avenue West7.53Km
- One Stop Coffee Shop32 Kennedy Rd N7.54Km
- Tim Hortons156 Sandalwood Parkway East7.58Km
- Brampton Italian Sport Cafe Ltd239 Queen St E7.65Km
- Il Piccolo Forno40 Innovation Dr7.74Km
- Coffee Time171 Advance Blvd7.76Km
- Cafe Estadio55 Selby Road7.76Km
- Starbucks20 Innovation Drive7.76Km
- Peggy's171 Advance Boulevard7.8Km
- Tim Hortons7195 Goreway Drive7.88Km
- Second Cup - Woodbridge140 Northview Blvd7.92Km
- Tim Hortons1150 Steeles Avenue East7.97Km
- Coffee Cave7205 Goreway Drive8Km
- Westwood Coffee Time7205 Goreway Dr8Km
- Trailside Park89 Pennyroyal Crescent1.05Km
- Snowcap Park29 Snow Leopard Court1.26Km
- William Sheard Parkette14 Red Stag Road1.55Km
- Jordan Park4 Don Doan Trail2.32Km
- Jefferson Park48-102 Jaffa Dr2.55Km
- Greenmount Park26 Greenmount Road3.26Km
- Brampton-Marikina Friendship Park14 Serences Way3.45Km
- Goldcrest Park15 Gleneaden Court3.46Km
- Black Forest Park South34 Willow Park Drive3.49Km
- Massey Park21 Morley Crescent3.55Km
- Black Forest Park North75 Black Forest Drive3.56Km
- Newcastle Park1170 Williams Parkway3.69Km
- Hilldale Park28 Hallcrown Court3.84Km
- Maitland Park69 Maitland Street3.84Km
- Fallingdale Park217 Gates of Bramalea4.02Km
- Chinguacousy Park9050 Bramalea Road4.08Km
- Claireville Conservation Areaundefined4.11Km
- Manitou Park8 Myrtle Court4.13Km
- Blue Oak Park11 Sugarpine Ct4.17Km
- Earnscliffe Park39 Evesham Crescent4.23Km
- Eastbourne Park8560 Torbram Road4.33Km
- Knightsbridge Park1 Kensington Rd4.54Km
- Sesquicentennial Park11575 Bramalea Road4.55Km
- Northhampton Park78-92 Nanport St4.79Km
- Leander Park2-16 Lupin Ct5.25Km
- Clark Park58 Brookland Drive5.33Km
- Bramalea Limited Community Park40 Nimrod Crescent5.51Km
- Norton Place Park170 Clark Blvd5.94Km
- Seaborn Park30 Barkwood Court6.54Km
- Weybridge Park146 Weybridge Trail6.89Km
- Richvale Dr NRichvale Dr N Brampton7.18Km
- Morris Kerbel Park3 Jay St7.49Km
- albert mcbride park3793 Teeswater Road7.67Km
- Kindle Parkette14 Elmvale Ave7.84Km
- Loafer's Lake Park30 Loafers Lake Lane7.91Km
- Golden Groceries60 Cottrelle Blvd0.23Km
- Linda's NOFRILLS9920 Airport Rd0.42Km
- Raman's NOFRILLS Brampton9920 Airport Rd0.42Km
- Vidhya Foods Inc28 Automatic Rd0.44Km
- Lcbo9970 Airport Rd0.48Km
- Bulk Barn9960 Airport Rd0.52Km
- Sandbanks9970 Airport Rd0.63Km
- Natural Herbal Beauty Shine Cream34 Prue Crt0.63Km
- Fresh Veggies8 Listcreek Rd0.72Km
- Burlodge Canada Ltd10 Edvac Dr0.87Km
- Fortinos55 Mountainash Road1.16Km
- Colio Estate Wines55 Mountainash Rd1.27Km
- Village Health Food50 Sunnyvale Gate1.27Km
- Sab Ka Bazaar2945 Sandalwood Pkwy E1.44Km
- Mian Grocer Inc2945 Sandalwood Parkway East1.45Km
- Asian Food Centre2120 North Park Drive1.5Km
- S a Supermarket & Water Depot470 Chrysler Dr1.59Km
- Asian Punjabi Bazar1098 Peter Robertson Blvd1.78Km
- Super Save Subzi Mandi Cash & Carry1098 Peter Robertson Blvd1.8Km
- Vintner's Cellar Bramalea1650 Williams Pky1.85Km
- Johnny's International Market1650 Williams Pky1.85Km
- Lifestyles Global Network8 Dayspring Cir1.93Km
- Mondelez Canada Inc255 Chrysler Dr2.02Km
- Kraft Grocery Division255 Chrysler Dr2.02Km
- Kitchen Food Fair65 Braydon Blvd2.03Km
- Skjodt Barrett5 Precidio Crt2.15Km
- Grocery Depot86 Professors Lake Pkwy2.24Km
- Silani Sweet Cheese14 Precidio Crt2.27Km
- Fateh Grocery Depot31 Steeplebush Ave2.27Km
- Springdale Meat Market31 Steeplebush Ave2.29Km
- Grocery Depot31 Steeplebush Ave2.29Km
- Giant Tiger9065 Airport Rd2.32Km
- Supplement Superstore1250 Brant St2.33Km
- Hk International62 Maple Valley St2.38Km
- Ventures in Research164 Treeline Blvd2.4Km
- Beer Store2890 Queen St E2.52Km
- Indian Frootland9985 McVean Dr2.64Km
- Golden Groceries Ltd.10510 Torbram Road2.7Km
- Morinda Canada Co100 Exchange Dr2.73Km
- Fuel2Go Sports Nutrition Inc15 Gateway Blvd2.85Km
- Singh Foods900 Ray Lawson Boulevard2.94Km
- Mount Everest Supermarket25 Sunny Meadow Blvd2.94Km
- M&M Meat Shops9185 Torbram Road2.96Km
- Katies Body Spize Inc25 Cairnburg Dr3.01Km
- Never Enough Noni9 Eagle Trace Dr3.03Km
- Beer Store9025 Torbram Rd3.04Km
- Jas Supermarket9025 Torbram Rd3.05Km
- Sierra Custom Foods275 Walker Dr3.1Km
- Lcbo11785 Bramalea Rd3.12Km
- Indian Punjabi Bazaar115 Father Tobin Road3.3Km
- Private Recipes Ltd12 Indell Lane3.45Km
- Parmalat Canada220 Walker Dr3.47Km
- 4 Life12 Soapstone Trail3.48Km
- Sobeys10970 Airport Rd3.51Km
- Nafta Foods & Packaging420 Deerhurst Dr3.51Km
- Fresh Co10970 Airport Rd3.53Km
- Chalo FreshCo Bramalea & Sandalwood10615 Bramalea Rd3.54Km
- Fresh Co10615 Bramalea Rd3.54Km
- Sobeys10615 Bramalea Rd3.54Km
- The Wine Shop10970 Airport Rd3.56Km
- Chalo FreshCo Airport & Countryside10970 Airport Rd3.58Km
- FreshCo10970 Airport Rd3.63Km
- Flora Distributing & Manufacturing Ltd400 Deerhurst Dr3.64Km
- Golden Fleece Foods Emporium16 Baker Rd3.68Km
- MDC Delivery Svc69 Morley Cres3.68Km
- A1 Nutraceuticals21 Folkstone Cres3.73Km
- Italpasta Ltd199 Summerlea Rd3.75Km
- Sobeys930 North Park Drive3.78Km
- Vineyards the Wine Shoppe930 N Park Dr3.8Km
- Indian Subji Bazar10950 Goreway Dr3.82Km
- Sofina Foods Inc10 Armthorpe Rd3.83Km
- Patel Brothers8814 The Gore Road3.89Km
- Gem West Indian and Grocies1785 Queen St E3.94Km
- Olde York Potato Chips230 Deerhurst Dr4.07Km
- Halal Beef Jerky23 Enmount Dr4.13Km
- Asian Food Centre21 Lacoste Blvd4.15Km
- Martin's Family Fruit Farm22 Donway Crt4.2Km
- Bramalea Fruit Market1729 Queen St E4.21Km
- Fantasy Fruit Market Ltd1729 Queen St E4.26Km
- FreshCo630 Peter Robertson Bl4.26Km
- Russell Marketing Inc77 Milford Cres4.37Km
- Krown Convenience9 860 North Park Dr4.38Km
- Mekkah Grocer & Halal Meat8550 Torbram Rd4.4Km
- Golden Groceries Ltd4525 Ebenezer Road4.47Km
- Asian Cash & Carry8917 The Gore Road4.49Km
- Food City8917 the Gore Rd4.5Km
- Ever Fresh Mart4525 Ebenezer Road4.52Km
- Quality Meat Market8907 the Gore Rd4.54Km
- Casa Italia65 Deerhurst Dr4.54Km
- Yama's NOFRILLS Brampton700 Balmoral Dr4.55Km
- Hasty Market25 Kings Cross Rd4.56Km
- Deman Supplements700 Balmoral Dr4.56Km
- Panchvati Supermarket8814 The Gore Road4.56Km
- Rabba Fine Foods17 Kings Cross Road4.58Km
- African Supermarket & Beauty Supplies8887 The Gore Road4.58Km
- Subzi Mundi8897 the Gore Rd4.61Km
- Dealers Ingredients Div of Dealers Dairy CanadaLtd1995 Clark Blvd4.64Km
- Singh's Farm 54525 Ebenezer Rd4.64Km
- Fruits & Légumes Piché90 Nexus Ave4.64Km
- Skilcor Northbud175 Nuggett Crt4.66Km
- Skilcor Food Products Inc175 Nuggett Crt4.66Km
- No Frills700 Balmoral Drive4.66Km
- Sobeys Store Fredericton Mall63 Huntingwood Cres4.67Km
- M & M Culture Diversity71 Starhill Cres4.7Km
- Sandbanks11785 Bramalea Rd4.78Km
- FreshCo Bramalea City Centre12 Team Canada Dr4.82Km
- FreshCo12 Team Canada Dr4.82Km
- Sobeys12 Team Canada Dr4.82Km
- Vineyards the Wine Shoppe25 Peel Centre Dr4.88Km
- Nature's Sunshine Products Of Canada Ltd90 Walker Dr4.95Km
- Wine Rack20 Great Lakes Drive5Km
- Caledon Sabji Mandi12050 Airport Rd5.05Km
- Caledon Sabzi Farm12050 Airport Rd5.05Km
- Wine Rack20 Great Lakes Dr5.06Km
- S & H Health Foods25 Peel Centre Dr5.13Km
- Laura Secord25 Peel Centre Dr5.13Km
- Good Health Mart50 Peel Centre Drive5.13Km
- Wine Rack25 Peel Centre Dr5.13Km
- Abundant Living12863 Heart Lake Rd5.13Km
- The Beer Store2890 Hwy 7 E5.13Km
- Power House65 Seachart Pl5.13Km
- Natures Sunshine Products of Canada44 Peel Centre Dr5.14Km
- The Wine Shop 28Bramalea City Centre Dr5.16Km
- Bulk'N Bits25 Peel Centre Dr5.17Km
- Organics Live - Brampton12 Niles Crt5.18Km
- Arterra Wines11785 Bramalea Rd5.21Km
- Sobeys3998 Cottrelle Blvd5.22Km
- Chalo FreshCo Cottrelle Blvd3998 Cottrelle Blvd5.22Km
- Royal Meridian Preparatory School12 Automatic Rd0.54Km
- Clayton Sales & Service13 Edvac Dr0.9Km
- Peel District School Board40 Fairlawn Blvd1.02Km
- Beacon House Academy2023 Williams Pky1.1Km
- Fairlawn Public School40 Fairlawn Boulevard1.13Km
- Ontario eSecondary School2131 Williams Pky1.18Km
- Oxford Learning Centres55 Mountainash Rd1.27Km
- Father Clare Tipping School25 Mountainberry Rd1.34Km
- Dufferin-Peel Catholic District School Board25 Mountainberry Rd1.4Km
- Spring Castle Montessori School160 Mountainash Road1.47Km
- Peel District School Board160 Mountainash Rd1.57Km
- Robert J Lee Public School160 Mountainash Rd1.63Km
- Professional Drivers of Canada Inc.2120 North Park Drive1.66Km
- Knox Bridge School9886 Torbram Rd1.67Km
- Boni Montessori School9886 Torbram Road1.67Km
- Red Willow Public School3975 Cottrelle Blvd1.81Km
- One-On-One Tutoring26 Rankin Crt1.96Km
- Dufferin-Peel Catholic District School Board55 Lexington Rd2.01Km
- Calderstone Middle School160 Calderstone Road2.19Km
- Nucleus High School2250 Bovaird Drive East2.25Km
- Treeline Public School145 Treeline Blvd2.38Km
- Sandalwood Heights Secondary School2671 Sandalwood Parkway East2.38Km
- Peel District School Board145 Treeline Blvd2.45Km
- Eagle Plains Public School40 Eagle Plains Dr2.5Km
- St Thomas Aquinas Secondary School25 Corporation Dr2.52Km
- Dufferin-Peel Catholic District School Board25 Corporation Dr2.53Km
- Dufferin-Peel Catholic District School Board28 Red River Dr2.53Km
- Walnut Grove Public School9911-9985 McVean Drive2.54Km
- Peel District School Board33 Greenbriar Rd2.55Km
- St John Bosco Elementary Schl1025 N Park Dr2.56Km
- Dufferin-Peel Catholic District School Board1025 N Park Dr2.57Km
- Grenoble Public School33 Greenbriar Rd2.58Km
- Good Shepherd Elementary School28 Red River Dr2.58Km
- Peel District School Board280 Mountainash Rd2.63Km
- Dufferin-Peel Catholic District School Board25 Bloomsbury Ave2.79Km
- Larkspur Public School95-109 Larkspur Rd2.79Km
- Greenbriar Sr Public School1140 Central Park Dr2.81Km
- Greenbriar Senior Public School1140 Central Park Drive2.82Km
- Jefferson Public School48 Jefferson Rd2.84Km
- Lester B. Pearson Catholic Elementary School140 Howden Boulevard2.88Km
- Chinguacousy Secondary School1370 Williams Pkwy2.9Km
- Heart2Heart CPR45 Coventry Rd3.02Km
- Dufferin-Peel Catholic District School Board115 Glenvale Blvd3.06Km
- Holy Name of Mary Catholic Secondary School15 Glenvale Boulevard3.07Km
- Dufferin-Peel Catholic District School Board63 Glenforest Rd3.07Km
- Aliman School253 Summerlea Rd3.12Km
- Islamic Private Board of Education253 Summerlea Rd3.12Km
- St Jean Brebeuf Elementary63 Glenforest Rd3.16Km
- St Francis Xavier ES115 Glenvale Blvd3.16Km
- Sunny View Middle School30 Chapparal Dr3.23Km
- Peel District School Board30 Chapparal Dr3.24Km
- Shaw Public School10 Father Tobin3.25Km
- St André Bessette Catholic Elementary25 Riverstone Dr3.32Km
- Peel District School Board286 Sunny Meadow Blvd3.36Km
- North Peel Public School1305 Williams Pky3.43Km
- Judith Nyman Secondary School1305 Williams Parkway3.44Km
- Stanley Mills Public School286 Sunny Meadow Boulevard3.44Km
- Goldcrest Public School14-34 Goldcrest Rd3.51Km
- Dufferin-Peel Catholic District School Board950 North Park Dr3.51Km
- Peel District School Board24 Goldcrest Rd3.53Km
- Folkstone Public School104 Folkstone Cres3.53Km
- St Anthony Elementary School950 N Park Dr3.54Km
- Massey Public School95 Massey St3.58Km
- Hewson Public School235 Father Tobin Road3.6Km
- Studyplas26 Arrowstone Crt3.63Km
- Williams Parkway Sr Public1285 Williams Pkwy.3.7Km
- Peel District School Board95 Massey St3.7Km
- Claireville Public School97 Gallucci Crescent3.71Km
- Hilldale Public School90-100 Hilldale Crescent3.73Km
- Georges Vanier Catholic28 Finchgate Blvd3.78Km
- Fernforest Public School275 Fernforest Drive3.78Km
- Peel District School Board275 Fernforest Dr3.79Km
- Northview Collegiate2 Dewside Dr3.79Km
- Divine High School9995 McVean Dr3.81Km
- Castlemore Public School9916 the Gore Rd3.81Km
- Dufferin-Peel Catholic District School Board28 Finchgate Blvd3.85Km
- Dufferin-Peel Catholic District School Board69 Maitland St3.89Km
- Khalsa Community School69 Maitland Street3.92Km
- Mother Mary Ward Elementary69 Maitland St3.94Km
- Cardinal Ambrozic Catholic Secondary School10 Castle Oaks Crossing3.95Km
- Dufferin-Peel Catholic District School Board10 Castle Oaks Cross3.96Km
- Castlebrooke Secondary School10 Gardenbrooke Trail3.98Km
- Dufferin-Peel Catholic District School Board35 Black Oak Dr4.05Km
- Rosa's Centre221 Deerhurst Dr4.14Km
- Peel District School Bd4.14Km
- Louise Arbour Secondary School365 Father Tobin Rd4.14Km
- Mount Royal Public School64-94 Mt Royal Cir4.19Km
- Gobind Sarvar Brampton187 Deerhurst Dr4.19Km
- Springdale Public School100 Dewside Dr4.21Km
- Our Lady of Lourdes Catholic Elementary School25 Mount Royal Cir4.25Km
- Dufferin-Peel Catholic District School Board25 Mount Royal Cir4.25Km
- Thorndale Public School30-58 Mauve Dr4.26Km
- Peel District School Board100 Dewside Dr4.27Km
- Fallingdale Public Schoolundefined4.28Km
- Dufferin-Peel Catholic District School Board140 Howden4.3Km
- Father Mj McGivney Elementary School450 Fernforest Dr4.32Km
- Dufferin-Peel Catholic District School Board450 Fernforest Dr4.34Km
- Earnscliffe Public School50 Earnscliffe Cir4.35Km
- Tall Pines School Inc8525 Torbram Rd4.39Km
- Lester B Pearson Catholic140 Howden Blvd4.4Km
- Peel District School Board510 Clark Blvd4.46Km
- Lougheed Middle School475 Father Tobin Road4.52Km
- Cardinal Newman Catholic698 Balmoral Dr4.57Km
- Eastbourne Drive Public School702 Balmoral Drive4.64Km
- Right Space Technologies102 Walker Drive4.64Km
- Body Pro Beauty & Aesthetics Academy Inc.700 Balmoral Drive4.66Km
- Dufferin-Peel Catholic District School Board698 Balmoral Dr4.68Km
- Carberry Public School526 Fernforest Dr4.77Km
- Kinderkollege Primary School150 Central Park Drive4.78Km
- Skills For Employment, Life and Family150 Central Park Dr4.8Km
- Dufferin-Peel Catholic District School Boar d150 Central Park Dr4.8Km
- Peel District School Board45 Ironshield Dr4.82Km
- Hanover Road Public School215 Hanover Rd4.85Km
- St Marguerite Bourgeoys Elem550 N Park Dr4.86Km
- Beryl Ford Public SchoolIronshield Drive4.9Km
- Homeopathic Institute of North America56 Nasmith St4.94Km
- Peel District School Board45 Meltwater Cres4.99Km
- St. Marguerite d'Youville Secondary School10815 Dixie Road5.02Km
- Great Lakes Public School285 Great Lakes Drive5.04Km
- Harold M. Brathwaite Secondary School415 Great Lakes Drive5.06Km
- Russell D Barber Public School255 N Park Dr5.08Km
- Peel District School Board255 N Park Dr5.09Km
- Russell Barber Jr Y255 N Park Dr5.09Km
- Dufferin-Peel Catholic District School Board10815 Dixie Rd5.09Km
- Bramalea Secondary School510 Balmoral Dr5.12Km
- Shiloh Christian725 Balmoral Dr5.12Km
- Dufferin-Peel Catholic District School Board300 Great Lakes Dr5.12Km
- Maranatha Christian Academy395 North Park Dr5.13Km
- My Mom's Rasoi60 Cottrelle Blvd0.12Km
- China Palace60 Cottrelle Boulevard0.13Km
- Subway60 Cottrelle Boulevard0.13Km
- Turtle Jack's Airport20 Cottrelle Boulevard0.22Km
- Harvey's30 Cottrelle Boulevard0.22Km
- Wendy's9930 Airport Rd0.32Km
- Chicago's Pizza Twist - Brampton, on2730 N Park Dr0.33Km
- Taco Bell9940 Airport Road0.38Km
- KFCTriple Crown Dr0.38Km
- Swiss Chalet Rotisserie & Grill9950 Airport Road0.42Km
- Punjabi Restaurant And Sweets9980 Airport Rd0.46Km
- Nath Sweet & Chicken Corner in Brampton9899 Airport Rd0.47Km
- New city pizza9899 Airport Road #50.47Km
- Border Line18 Automatic Rd0.49Km
- Pizzaville9980 Airport Road0.61Km
- Gem's Jerk9980 Airport Road0.62Km
- Brar's - Bovaird2969 Bovaird Drive East0.75Km
- Sunset Grill2969 Bovaird Drive East0.78Km
- SPG Express Inc13 Edvac Dr0.9Km
- Pizza Depot HQ3 Automatic Rd0.9Km
- Pizza Depot0.92Km
- Touche Bakery Inc2110 Williams Pky0.93Km
- Kesar Sweets & Restaurant51 Mountainash Road1Km
- Shagun Sweets and Restaurant Inc51 Mountainash Rd1.04Km
- Starzz Design and Decor2500 Williams Pky1.05Km
- Kama Classical Indian Cuisine51 Mountainash Rd1.08Km
- Pizza Pizza55 Mountainash Road1.09Km
- Nancy Trattoria Restaurant2023 Williams Parkway1.1Km
- Kings Garden Chinese Food55 Mountainash Road1.1Km
- Lazeez Shawarma47 Mountainash Road1.12Km
- A & K's Sweet Creations22 Pennyroyal Cres1.13Km
- Gillz Sweet Factory2131 Williams Parkway1.13Km
- MR.SUB55 Mountainash Road1.14Km
- Real and Yummy Juice55 Mountainash Rd1.15Km
- McDonald's45 Mountainash Road1.15Km
- G'n Parkway Restaurant2051 Williams Pky1.16Km
- Ariya Takeout & Caterings50 Sunnyvale Gate1.2Km
- Baker's Jerk House50 Sunnyvale Gate1.2Km
- City North Pizza50 Sunnyvale Gate1.2Km
- Golden Star55 Mountainash Rd1.27Km
- Veggie Flames Inc50 Sunnyvale Gate1.27Km
- Pizza Pizza55 Mountainash Road1.28Km
- Hot and Sour Pak Indian Style Hakka51 Mountainash Rd1.3Km
- Pizza J42 Hollowgrove Blvd1.41Km
- Sweet Palace2945 Sandalwood Pkwy E1.44Km
- Molly's Hotte Shoppe475 Chrysler Drive1.45Km
- Mollys Hottee Shop and Roti490 Chrysler Dr1.46Km
- The Pie Guyz2120 N Park Dr1.48Km
- Surbis Kitchen145 Mountainash Rd1.48Km
- Sahib Jee2120 N Park Dr1.49Km
- Little Caesars Pizza2945 Sandalwood Pkwy E1.51Km
- Osmow's470 Chrysler Dr1.55Km
- Jothi Restaurant470 Chrysler Dr1.55Km
- Mangia Mangia Italian Eatery & Cafe Ltd470 Chrysler Dr1.55Km
- Pappu Sweets & Catering470 Chrysler Dr1.55Km
- Subway470 Chrysler Drive1.55Km
- Khalsa Pizza & Catering470 Chrysler Dr1.57Km
- That Italian Place Cafe and Eatery470 Chrystler Dr1.57Km
- T Tandoori Masala Indian Cuisine470 Chrysler Dr1.59Km
- Pizza Mart2130 N Park Dr1.6Km
- Premium Pizza Incc9886 Torbram Rd1.64Km
- Pizza Pros9886 Torbram Road1.67Km
- Three For One Piza & Wings9886 Torbram Rd1.67Km
- Essence Cakes9886 Torbram Rd1.67Km
- Golden Palace Restaurant9886 Torbram Road1.68Km
- Sweet Palace1098 Peter Robertson Boulevard1.73Km
- Papas Pizza Mamas Chicken1098 Peter Robertson Boulevard1.74Km
- Dalchini Hakka Chinese Restaurant1098 Peter Robertson Boulevard #101.77Km
- Raj Bhole Paan1098 Peter Robertson Blvd1.78Km
- Sweet Palace Restaurant1098 Peter Robertson Blvd1.8Km
- Pizza Route1098 Peter Robertson Boulevard1.8Km
- Vk Cakes N Bakes1098 Peter Robertson Blvd1.83Km
- Rocky's Yo China1098 Peter Robertson Blvd1.83Km
- Tandoori Dhaba1650 Williams Pky1.85Km
- Divine Cakes and Pastries114 Jade Cres1.9Km
- Onyxx Sports Bar and Grill70 Maritime Ontario Blvd1.9Km
- Grand Taj - Fine Indian Cuisine90 Maritime Ontario Blvd1.91Km
- Domino's Pizza1650 Williams Parkway1.92Km
- Atlantic Trini Food1650 Williams Parkway1.93Km
- McDonald's30 Bramtree Crt1.94Km
- Food Fight BBQ100 Maritime Ontario Boulevard1.94Km
- Lena's Roti and Doubles100 Maritime Ontario Blvd1.94Km
- Signature Scoop15 Jellicoe Cres2.01Km
- Pho 12339 Maritime Ontario Boulevard2.02Km
- fresh bite & Meat65 Braydon Blvd2.03Km
- Pizza Depot65 Braydon Boulevard2.05Km
- Madras Restaurant2280 Bovaird Drive East2.06Km
- Giggling Tomatoes Restaurant2280 Bovaird Dr E2.07Km
- Filmy Tadka50 Maritime Ontario Blvd2.08Km
- Cakes by Liz23 Balmy Way2.09Km
- Sugar Junkies Bakery Inc7 Rockstep Crt2.09Km
- Devon House Restaurant85 Watchman Rd2.11Km
- Chef Sanjeev Kapoor's Khazana9121 Airport Rd2.12Km
- Khazana9121 Airport Rd2.12Km
- Pizza Nova2260 Bovaird Drive East2.13Km
- Rajdhani Sweets2260 Bovaird Drive East2.13Km
- Fourpoints Telvision Productions2250 Bovaird Dr E2.14Km
- Royal Paan2260 Bovaird Drive East2.14Km
- Desserts by Linda16 Philosopher's Trail2.16Km
- Emma Canada International Inc9045 Airport2.17Km
- Toronto Softee58 Grassington Cres2.17Km
- Subway2260 Bovaird Dr2.17Km
- Tropical Escape Restaurant & Lounge2260 Bovaird Dr E2.17Km
- Tropical Escape Restaurant: manger, boire, restaurer, diner, déjeuner & Lounge2260 Bovaird Dr E2.17Km
- Dinah's Oven14 Gatewood Dr2.24Km
- Montana's9065 Airport Road2.24Km
- My Insurance Broker Corp2250 Bovaird Dr E2.26Km
- New Pizza House31 Steeplebush Avenue2.27Km
- Molisana Bakery2 Philosopher's Trail2.27Km
- 2 For 1 Pizza2 Philosopher's Trail2.27Km
- Canadian Hot Dog96 Maple Valley St2.28Km
- Airport Sweets Tandoory9899 Airport Rd2.3Km
- Firehouse Subs9055 Airport Rd2.3Km
- Booster Juice9055 Airport Rd2.3Km
- Standart Sweets and Snack31 Steeplebush Ave2.33Km
- Pita Nutso9045 Airport Rd2.35Km
- Pizza Hut9045 Airport Rd2.35Km
- Emily's Kitchen77 Greenbriar Rd2.37Km
- The Indian Flavour35 Sunny Meadow Bl2.37Km
- Tropical Escape35 Sunny Meadow Blvd2.37Km
- Giggling Tomatoes25 Sunny Meadow Bl Brampton2.39Km
- Nestle Canada Inc9050 Airport Rd2.39Km
- KFC9045 Airport Road2.4Km
- Thai Express - Woodhill Centre9045 Airport Rd2.41Km
- Thai Express9045 Airport Rd Unit M112.41Km
- Cora's Breakfast & Lunch9045 Airport Rd2.41Km
- Dairy Queen1965 Cottrelle Boulevard2.43Km
- Dee's Restaurant & Coffee Time18 Corporation Dr2.44Km
Walkscore
Schools
Back
1.44Km
22 min
3 min
1.55Km
23 min
3 min
2.15Km
32 min
4 min
2.42Km
36 min
5 min
2.5Km
37 min
5 min
2.53Km
38 min
5 min
2.55Km
38 min
5 min
2.58Km
39 min
5 min
2.63Km
39 min
5 min
2.73Km
41 min
5 min
2.89Km
43 min
6 min
2.97Km
45 min
6 min
3.08Km
46 min
6 min
3.13Km
47 min
6 min
3.16Km
47 min
6 min
3.28Km
49 min
7 min
3.29Km
49 min
7 min
3.52Km
53 min
7 min
3.88Km
58 min
8 min
3.96Km
59 min
8 min
3.96Km
59 min
8 min
4Km
60 min
8 min
4.1Km
61 min
8 min
4.1Km
62 min
8 min
4.29Km
64 min
9 min
4.32Km
65 min
9 min
4.41Km
66 min
9 min
4.45Km
67 min
9 min
4.66Km
70 min
9 min
4.73Km
71 min
9 min
4.84Km
73 min
10 min
4.98Km
75 min
10 min
Sir Isaac BrockBrampton, ON L6P3V8
4.99Km
75 min
10 min
5.11Km
77 min
10 min
5.12Km
77 min
10 min
Castle OaksBrampton, ON L6P3V4
5.14Km
77 min
10 min
5.18Km
78 min
10 min
5.19Km
78 min
10 min
5.26Km
79 min
11 min
5.38Km
81 min
11 min
5.38Km
81 min
11 min
5.48Km
82 min
11 min
5.48Km
82 min
11 min
5.6Km
84 min
11 min
Ross DriveBrampton, ON L6R3S7
5.64Km
85 min
11 min
5.94Km
89 min
12 min
5.95Km
89 min
12 min
Walnut GroveCaledon, ON L7C2P9
6.15Km
92 min
12 min
6.61Km
99 min
13 min
6.66Km
100 min
13 min


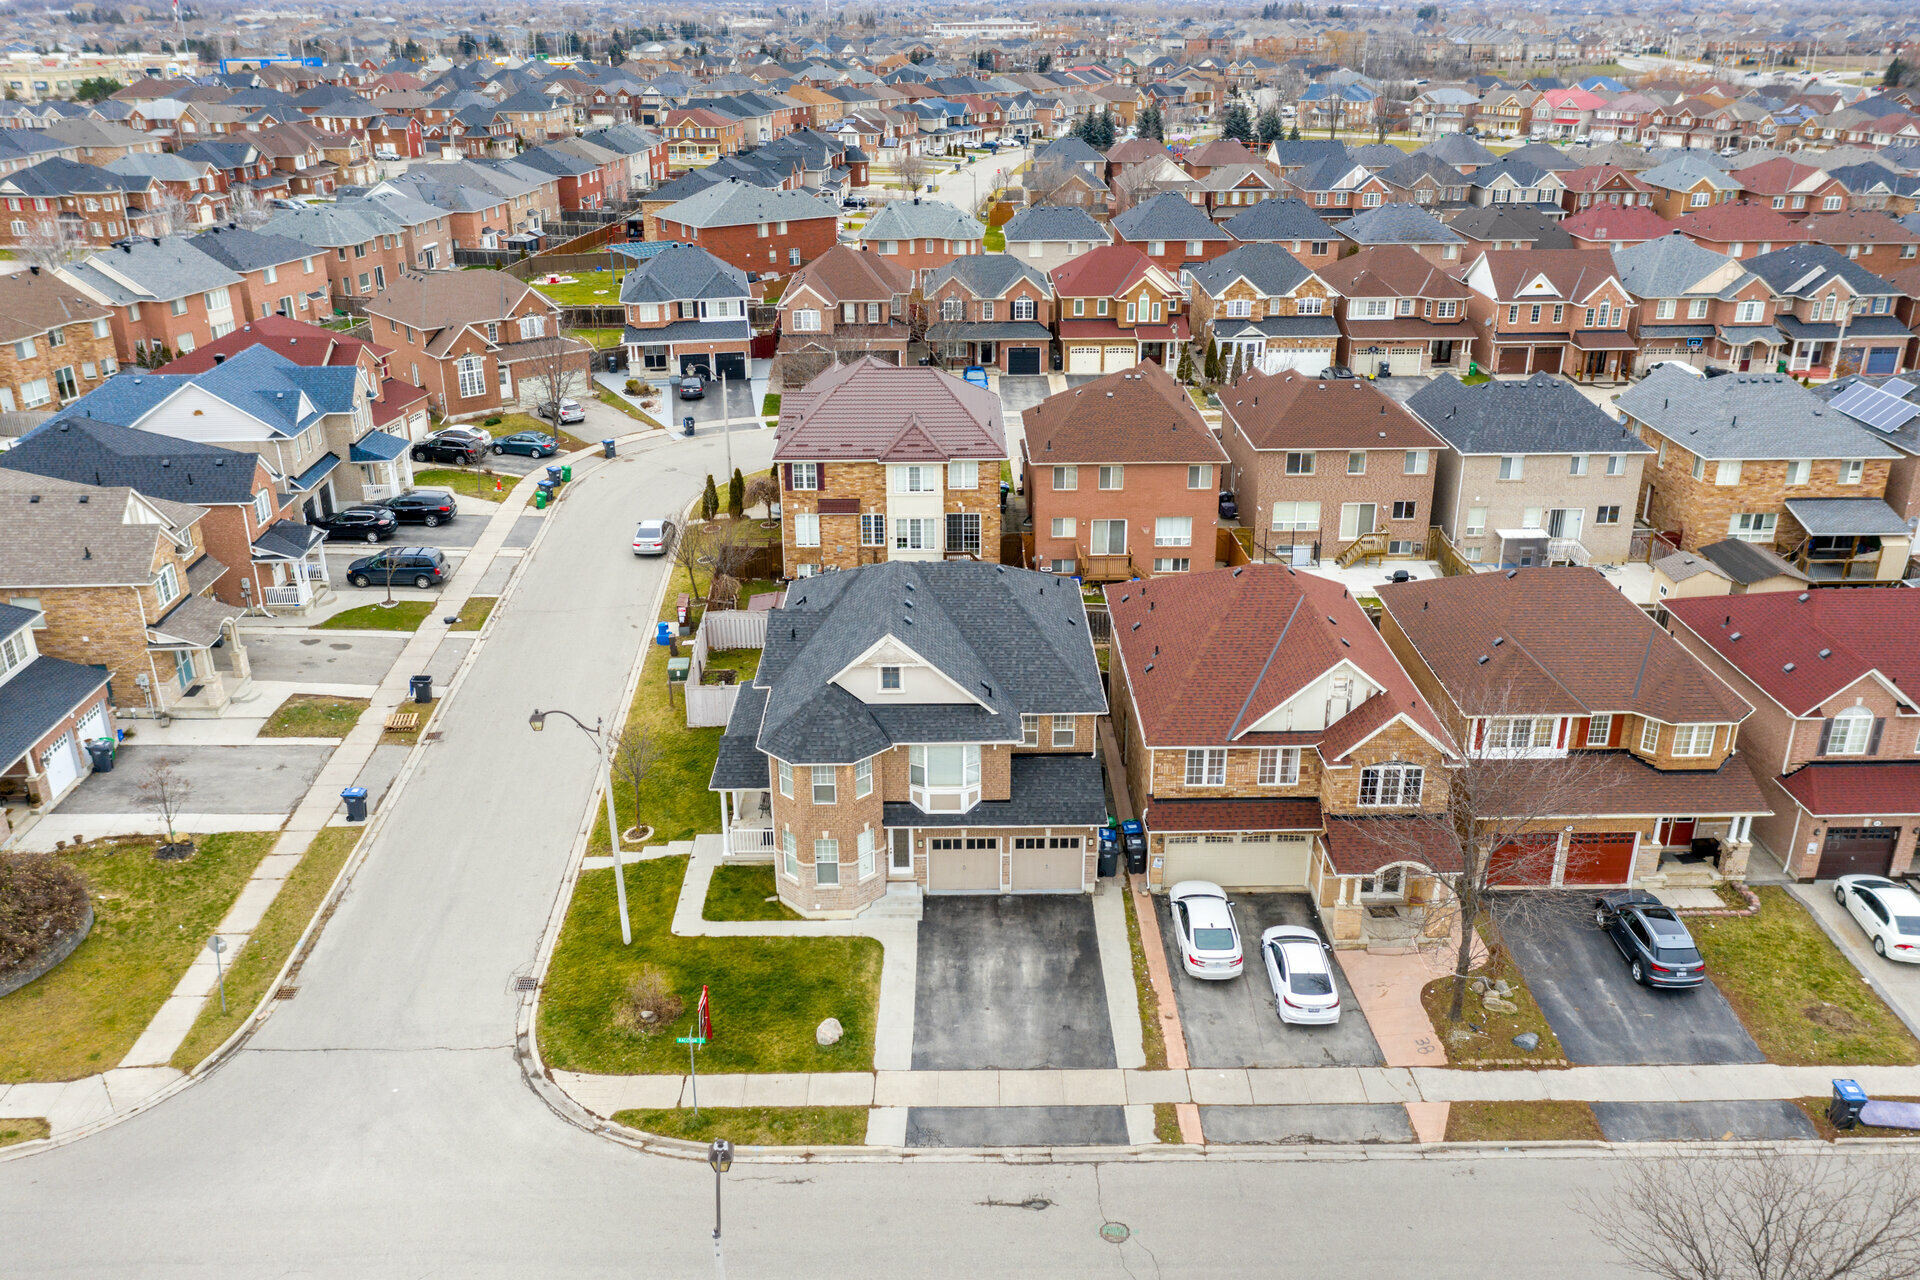
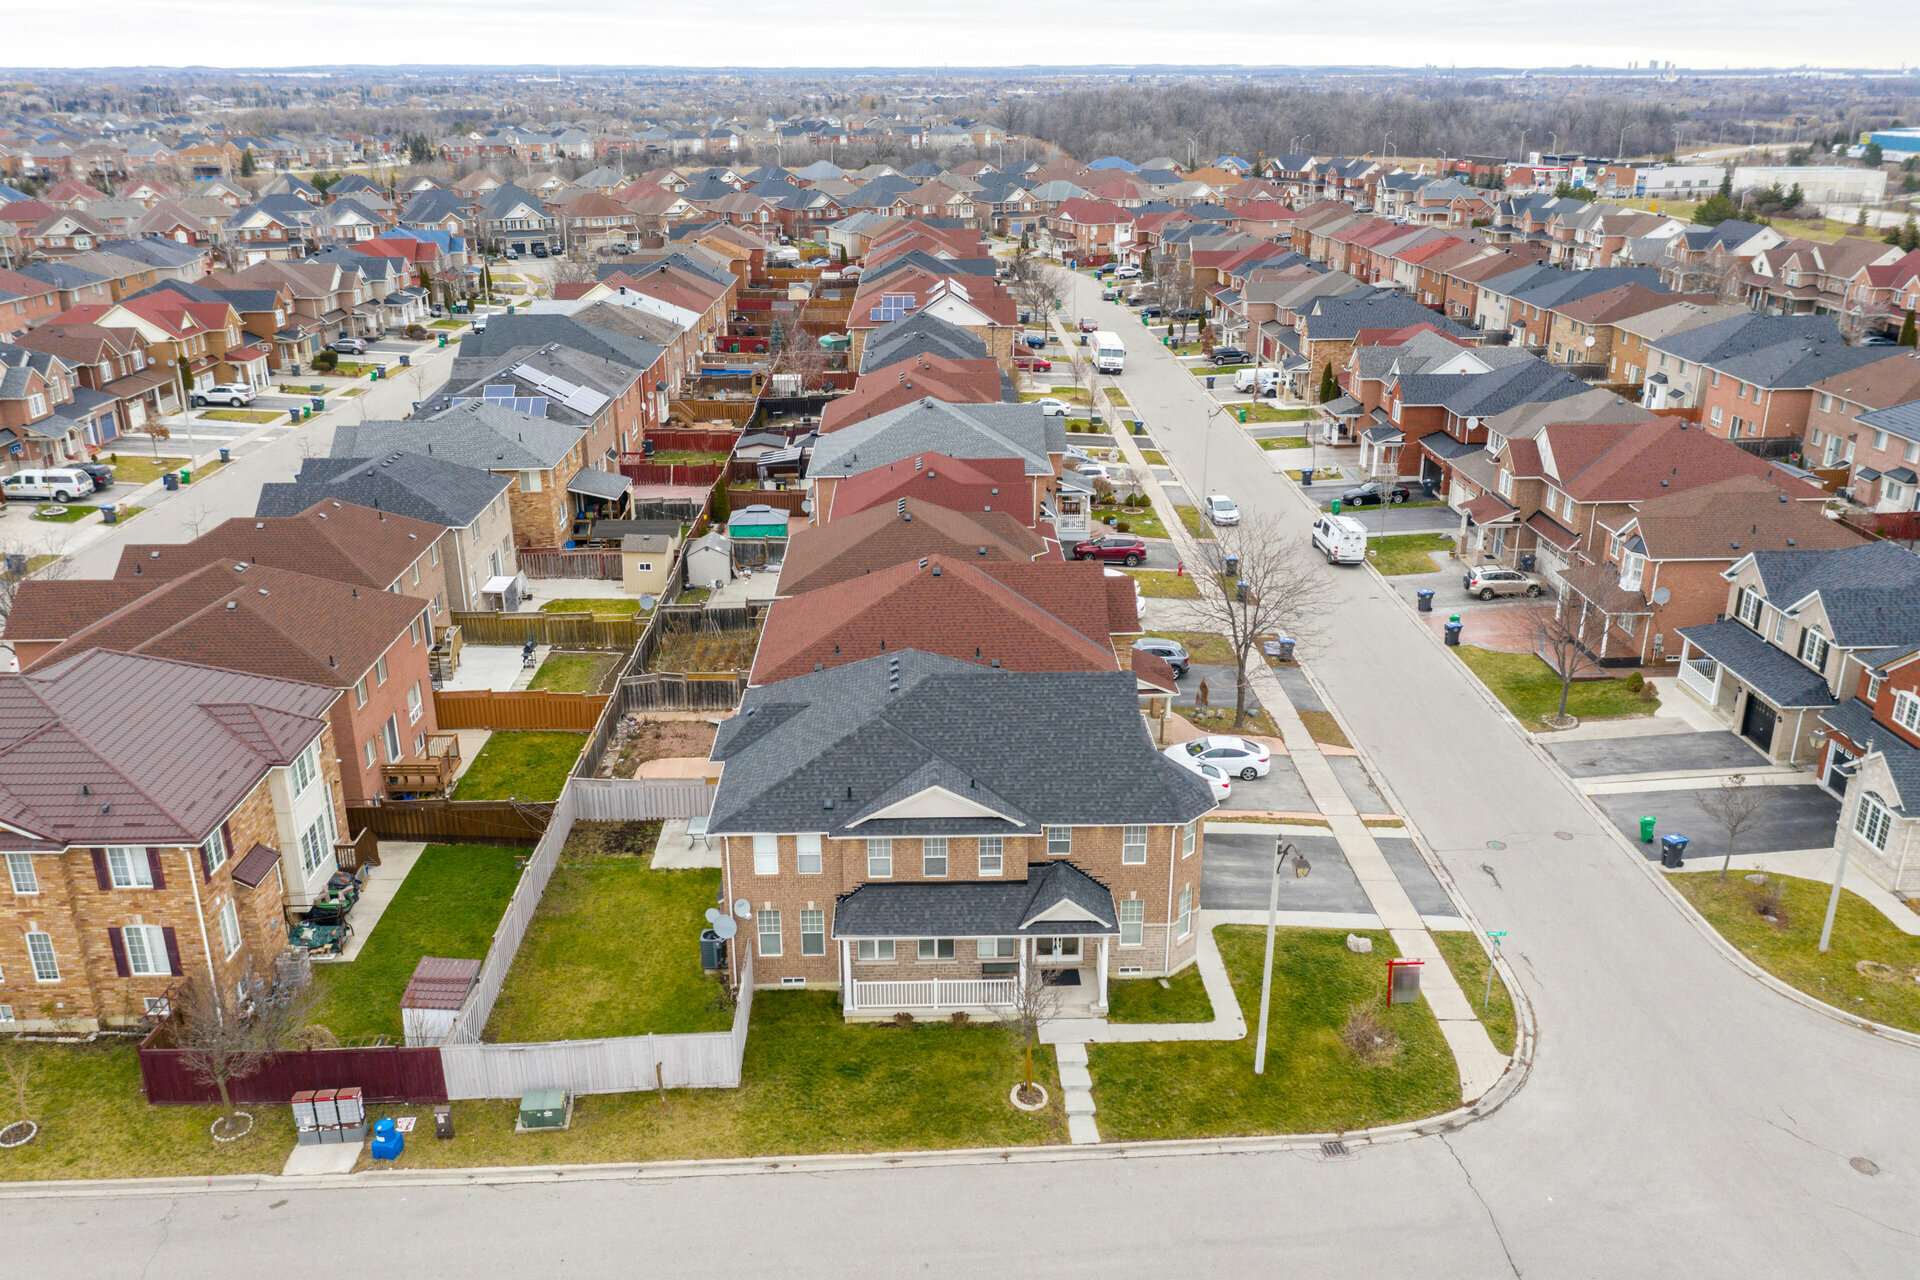
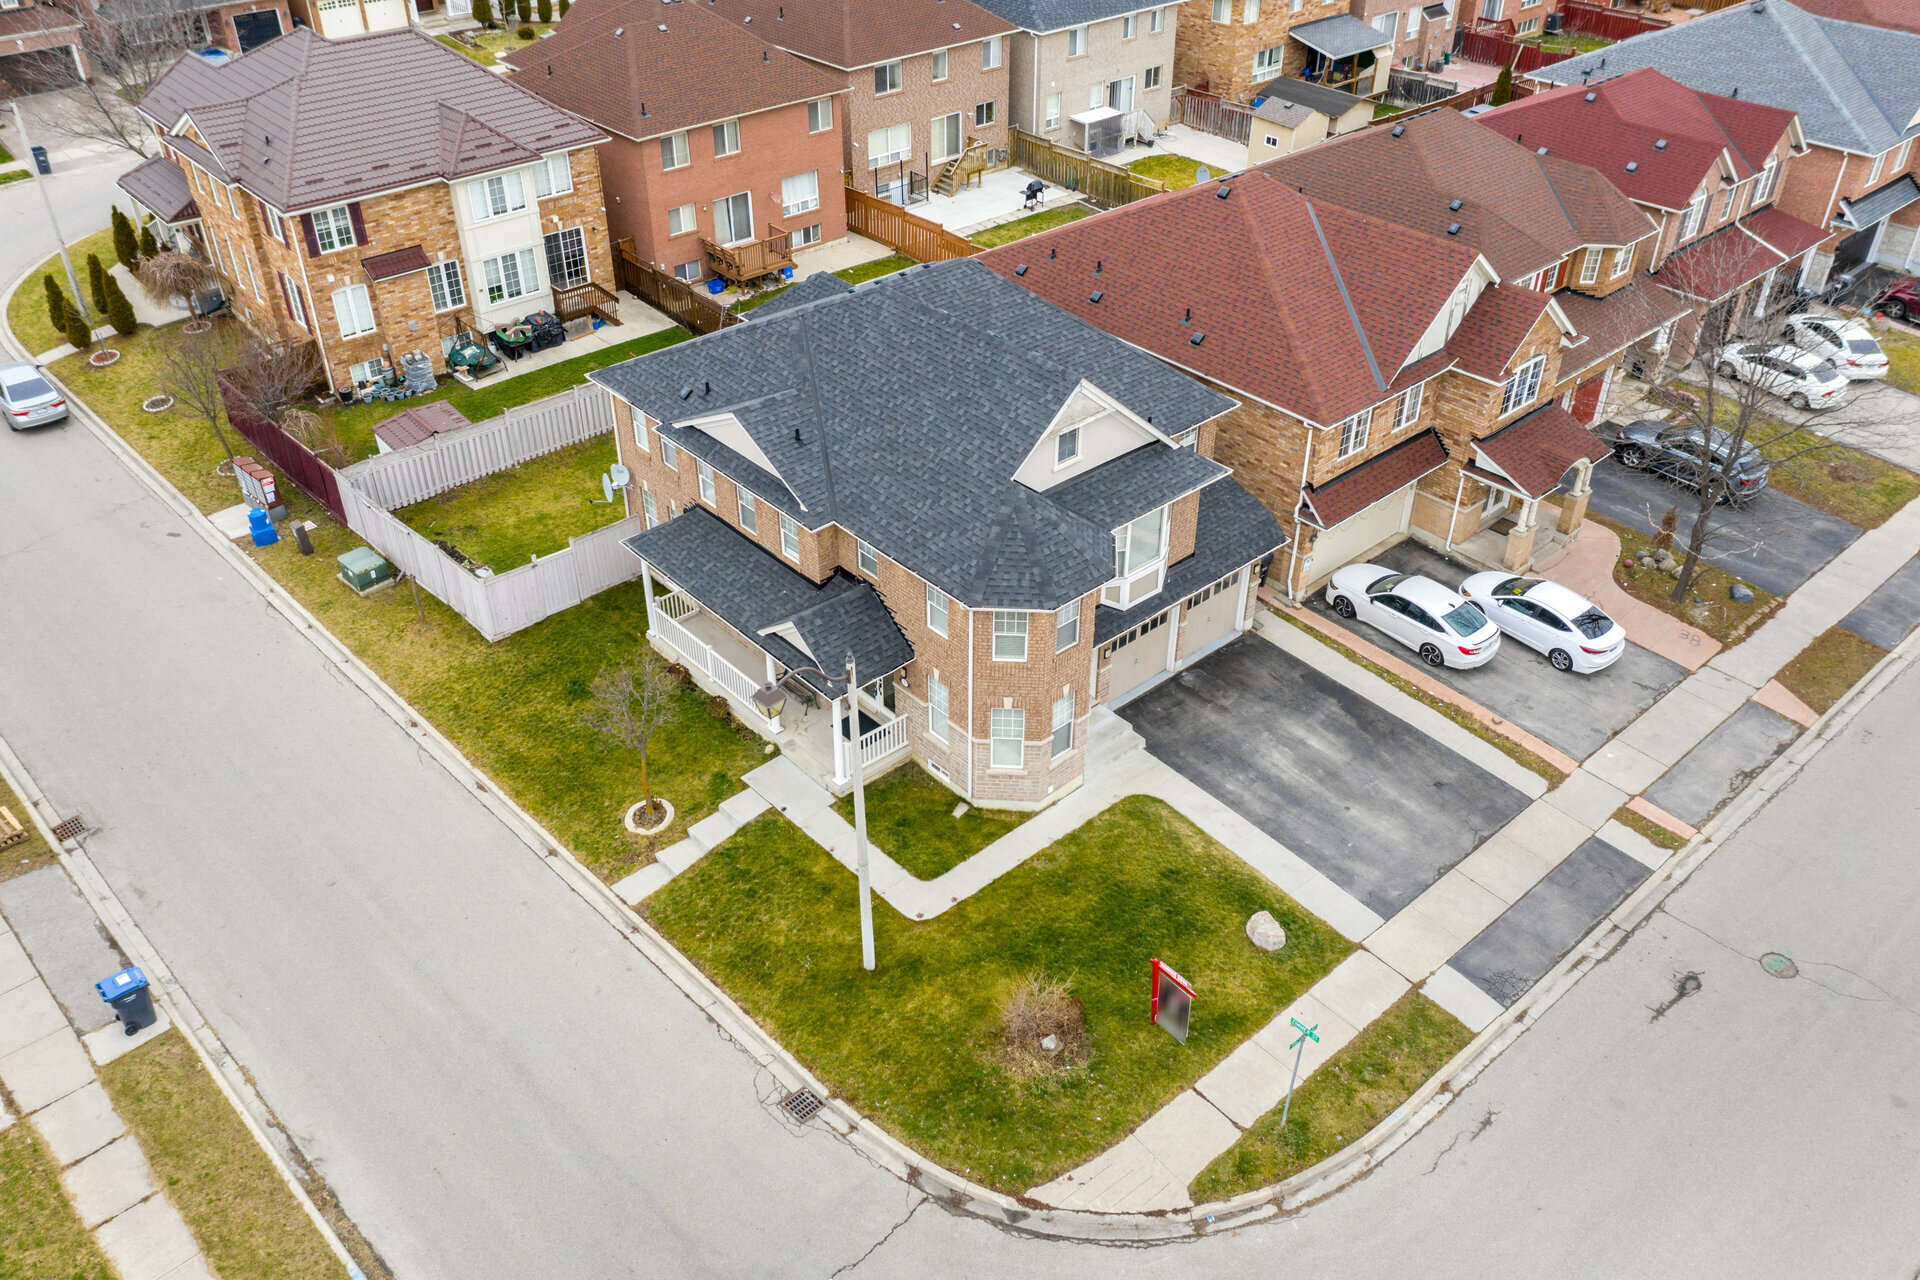
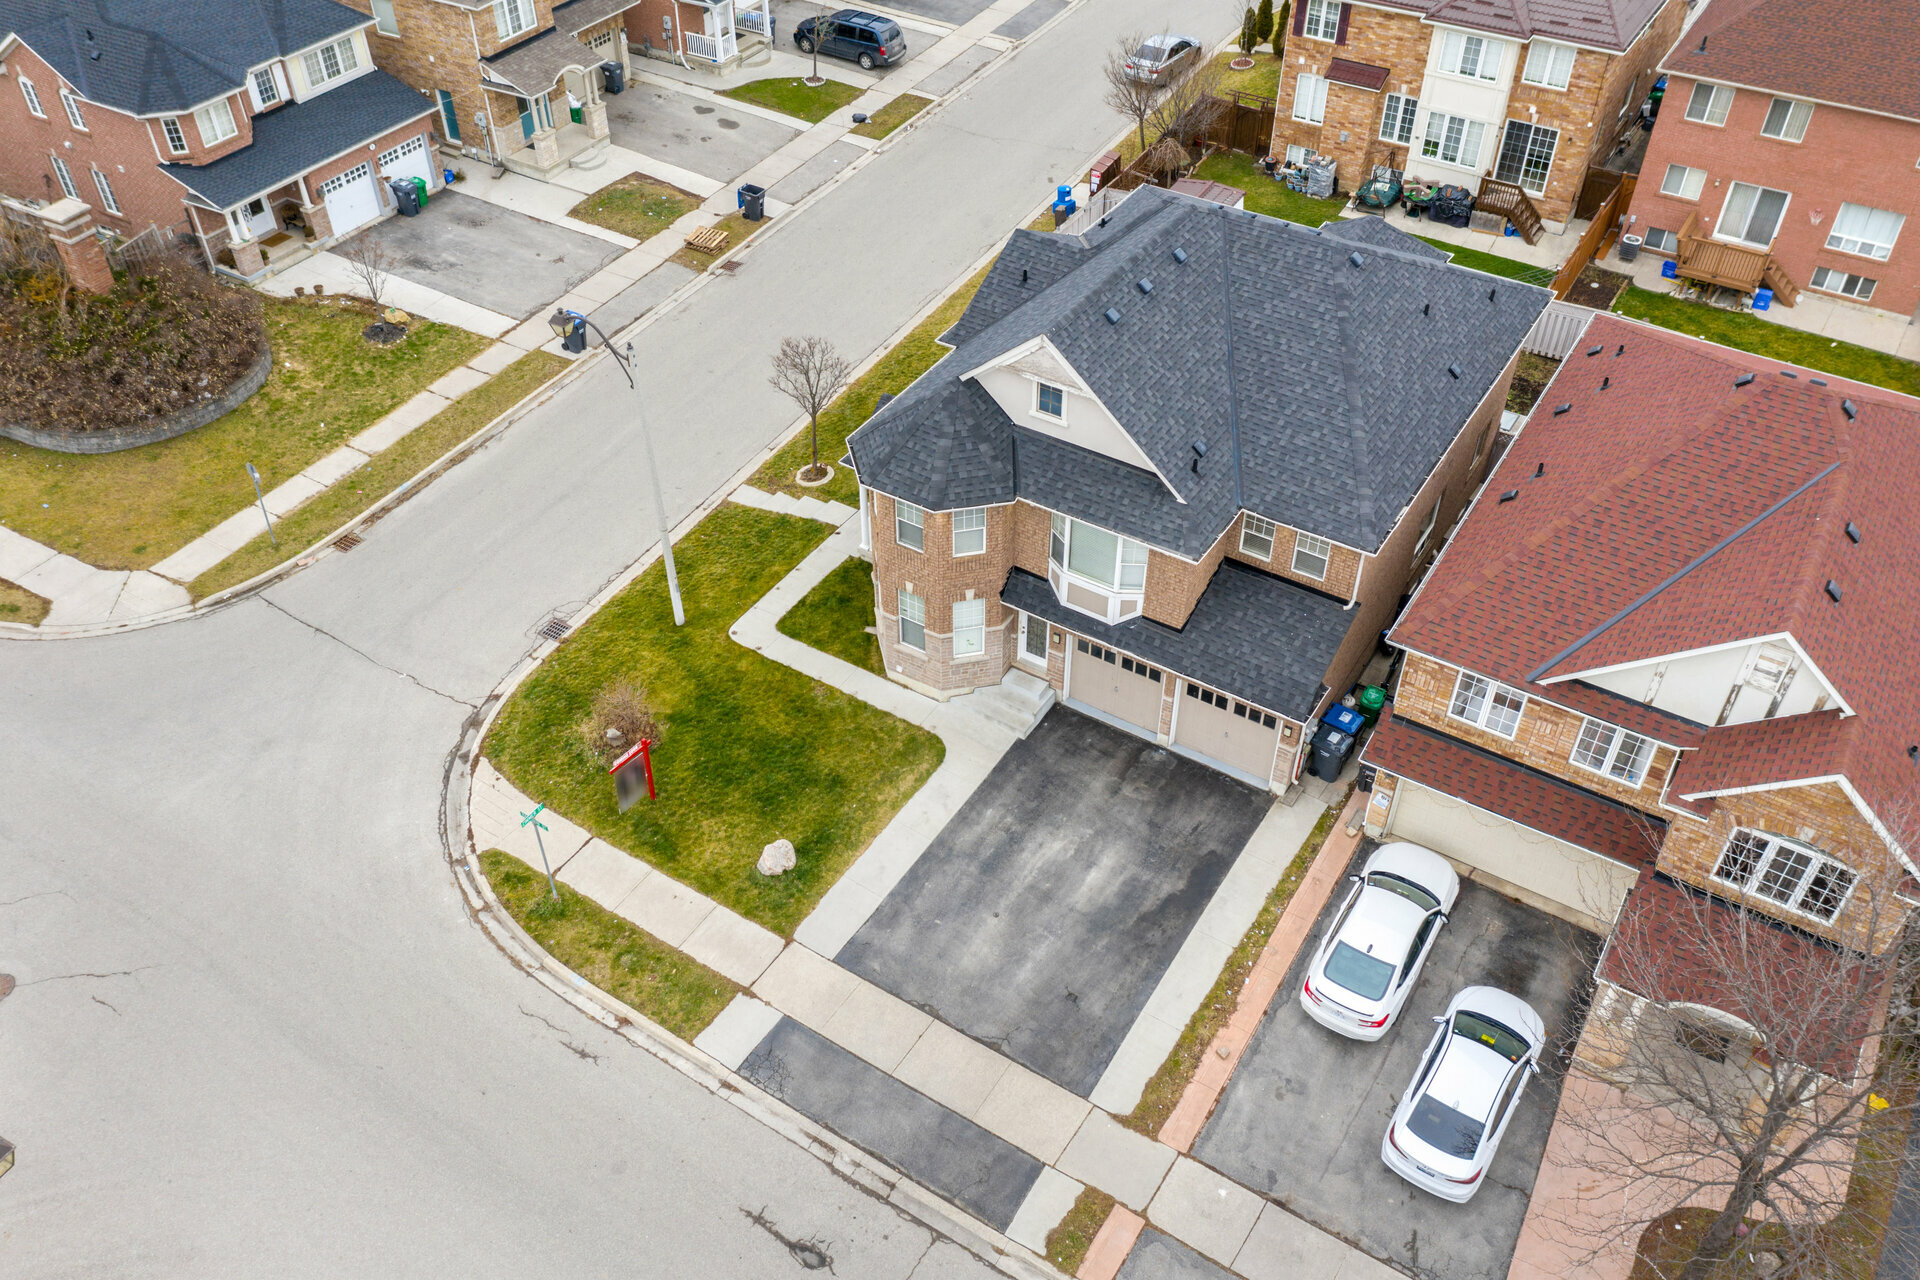
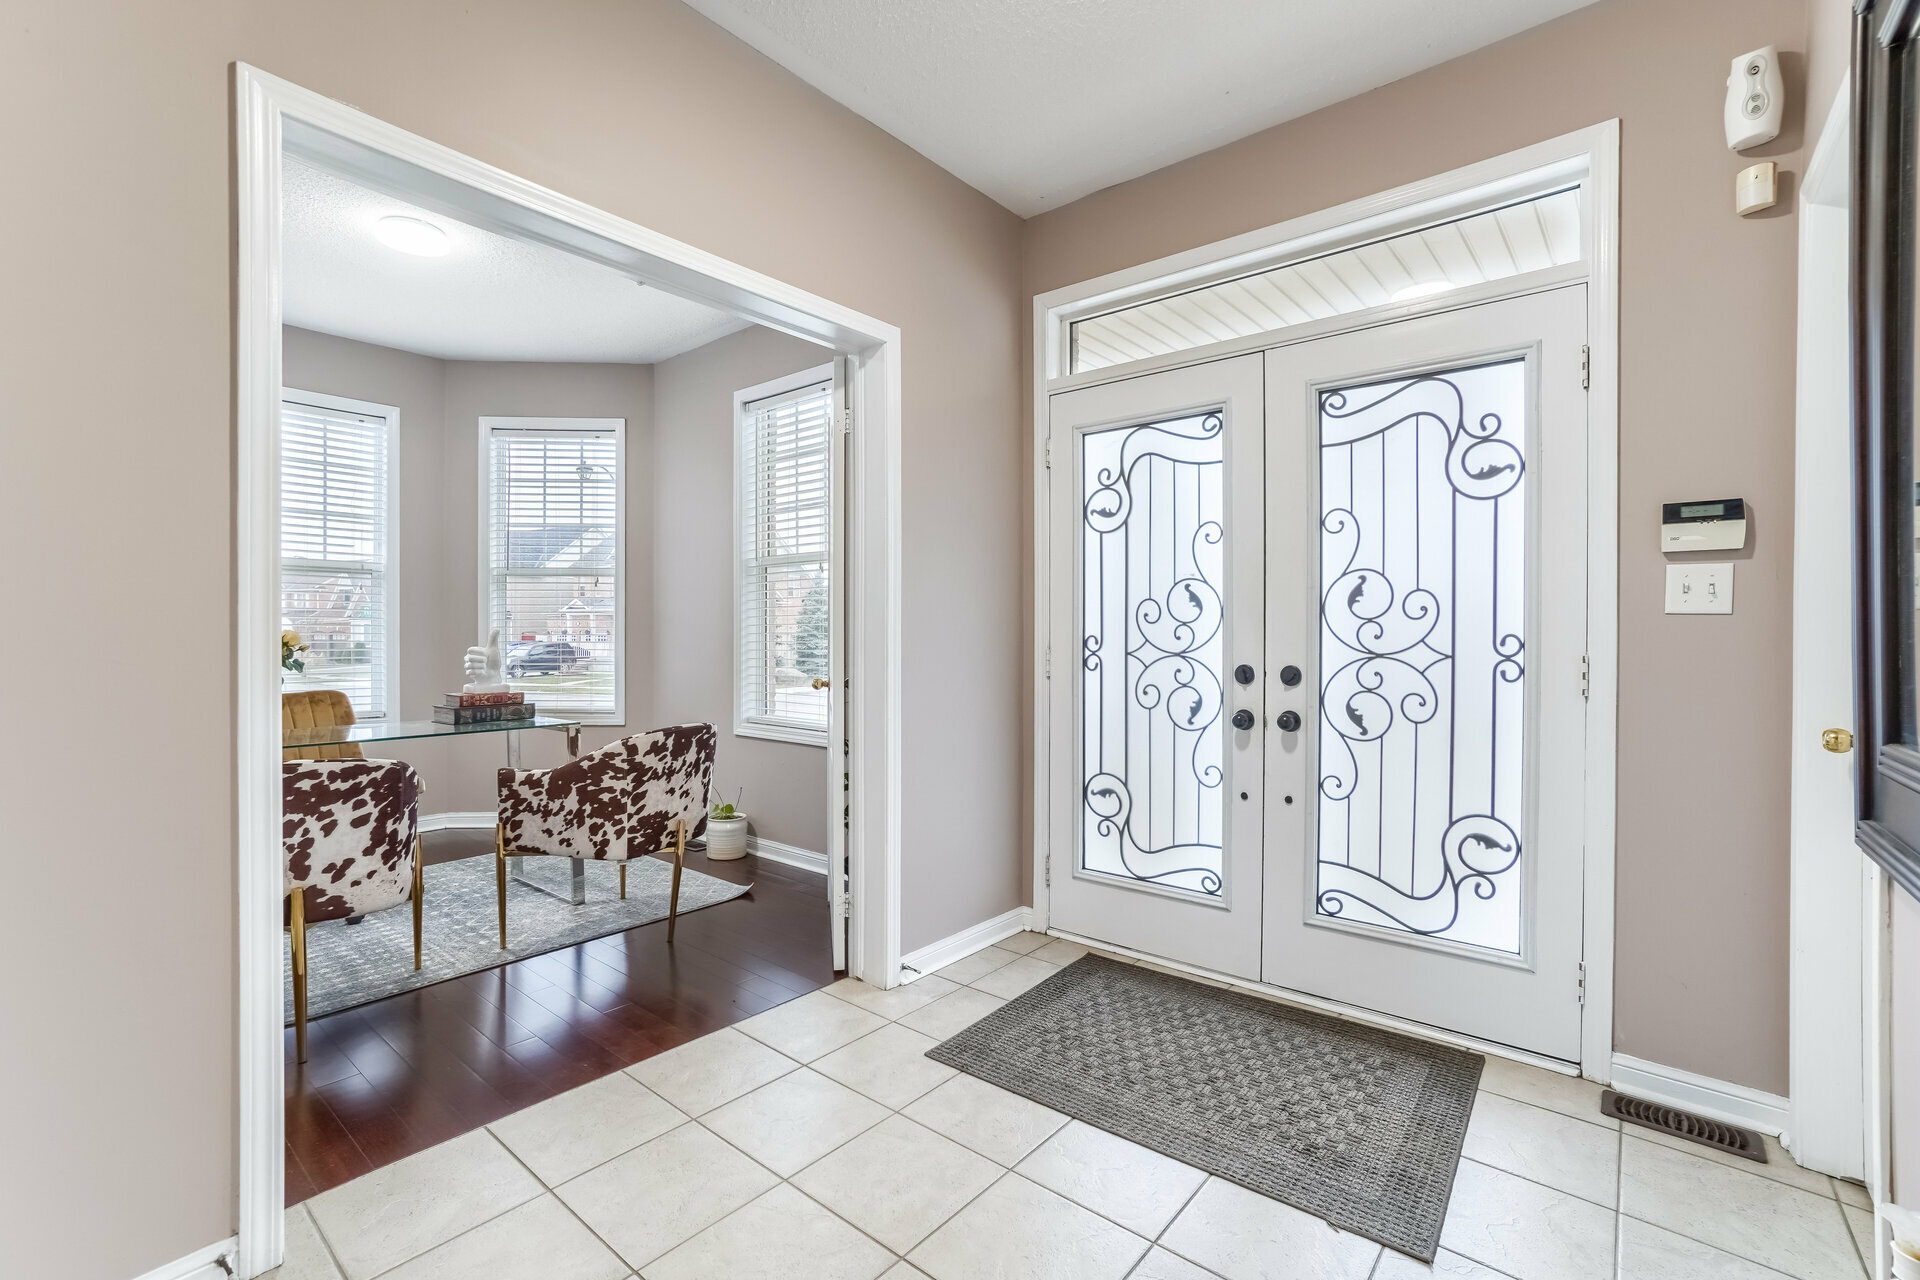
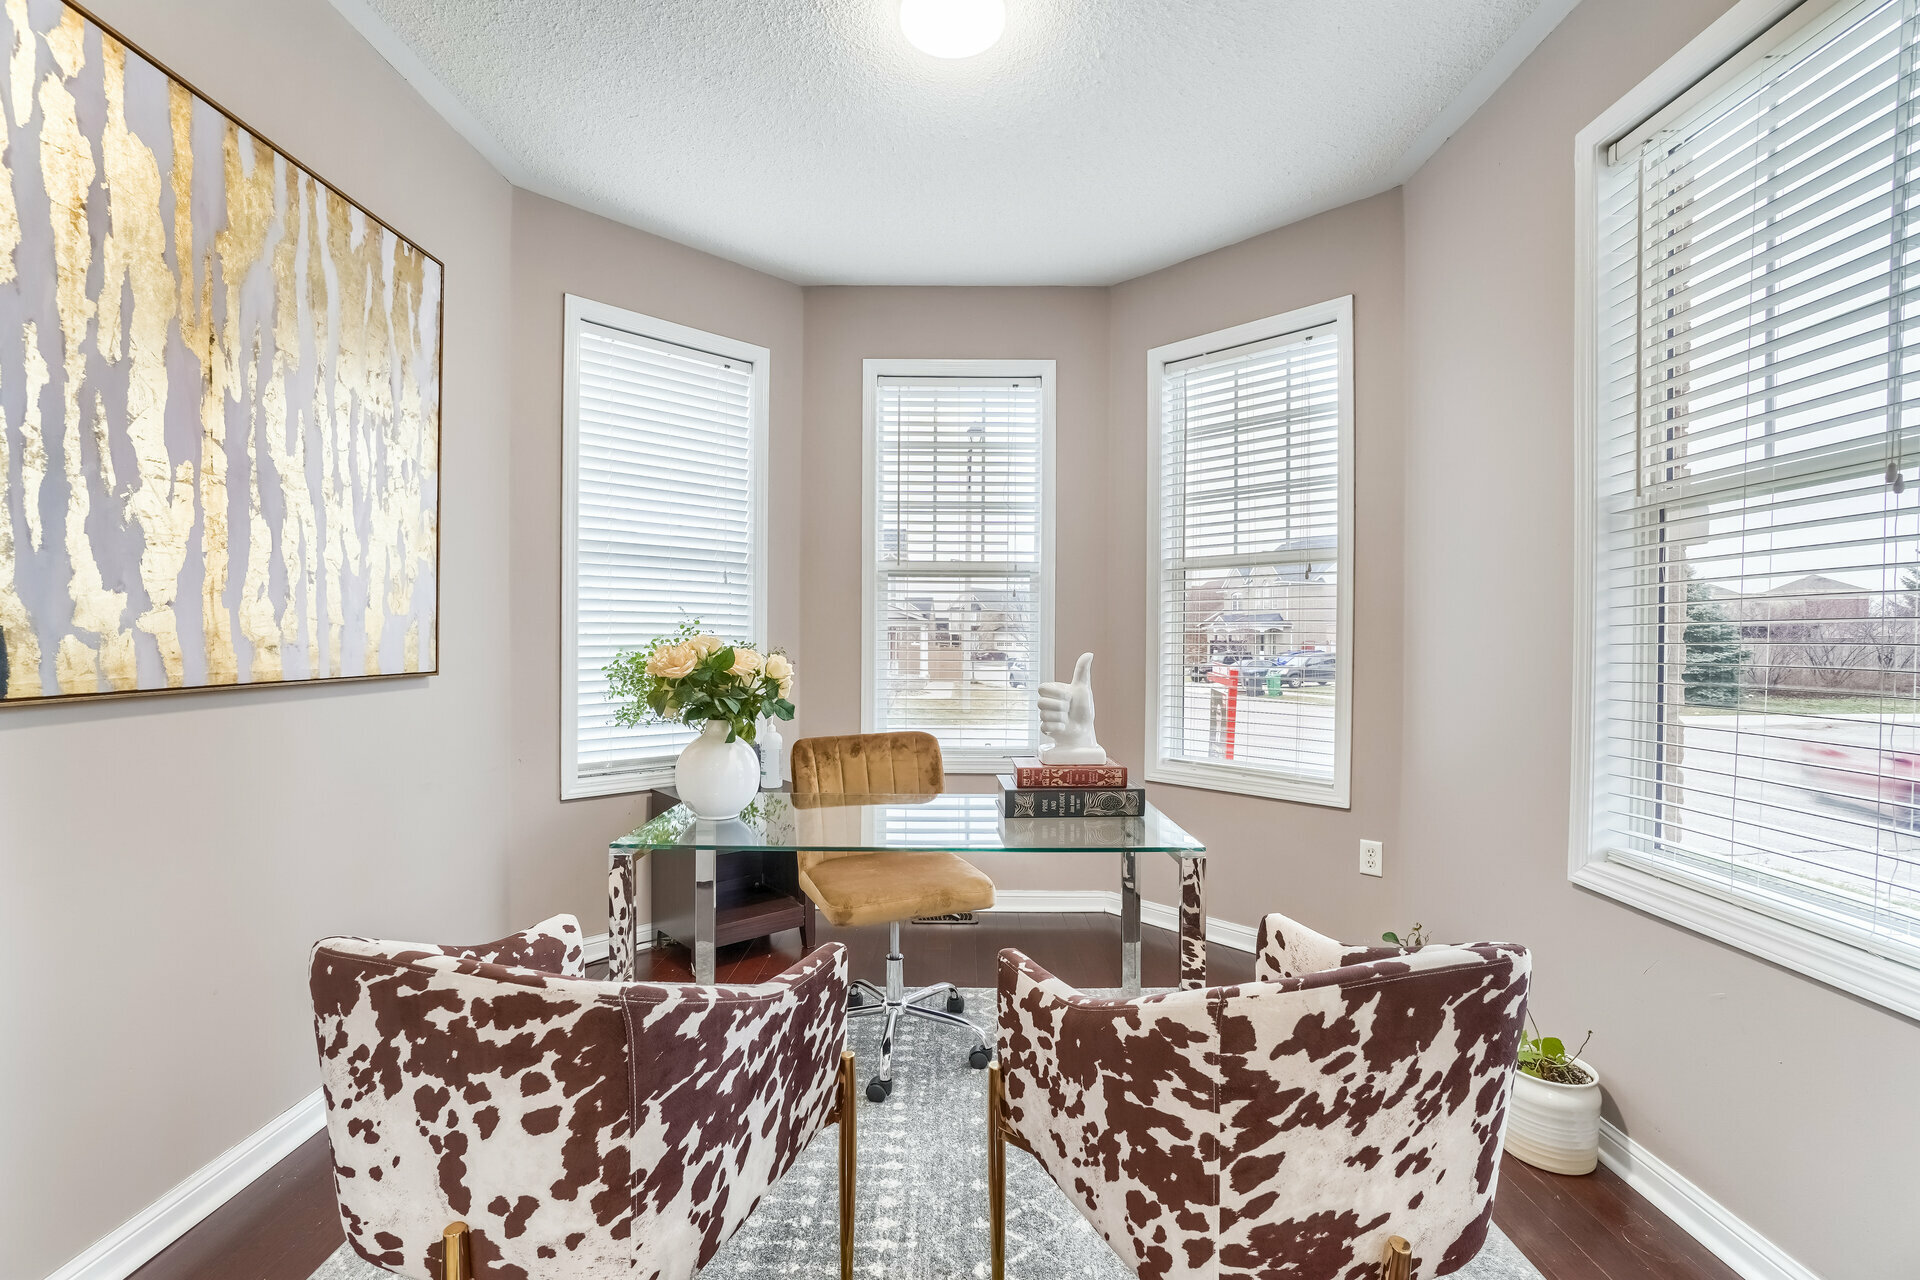
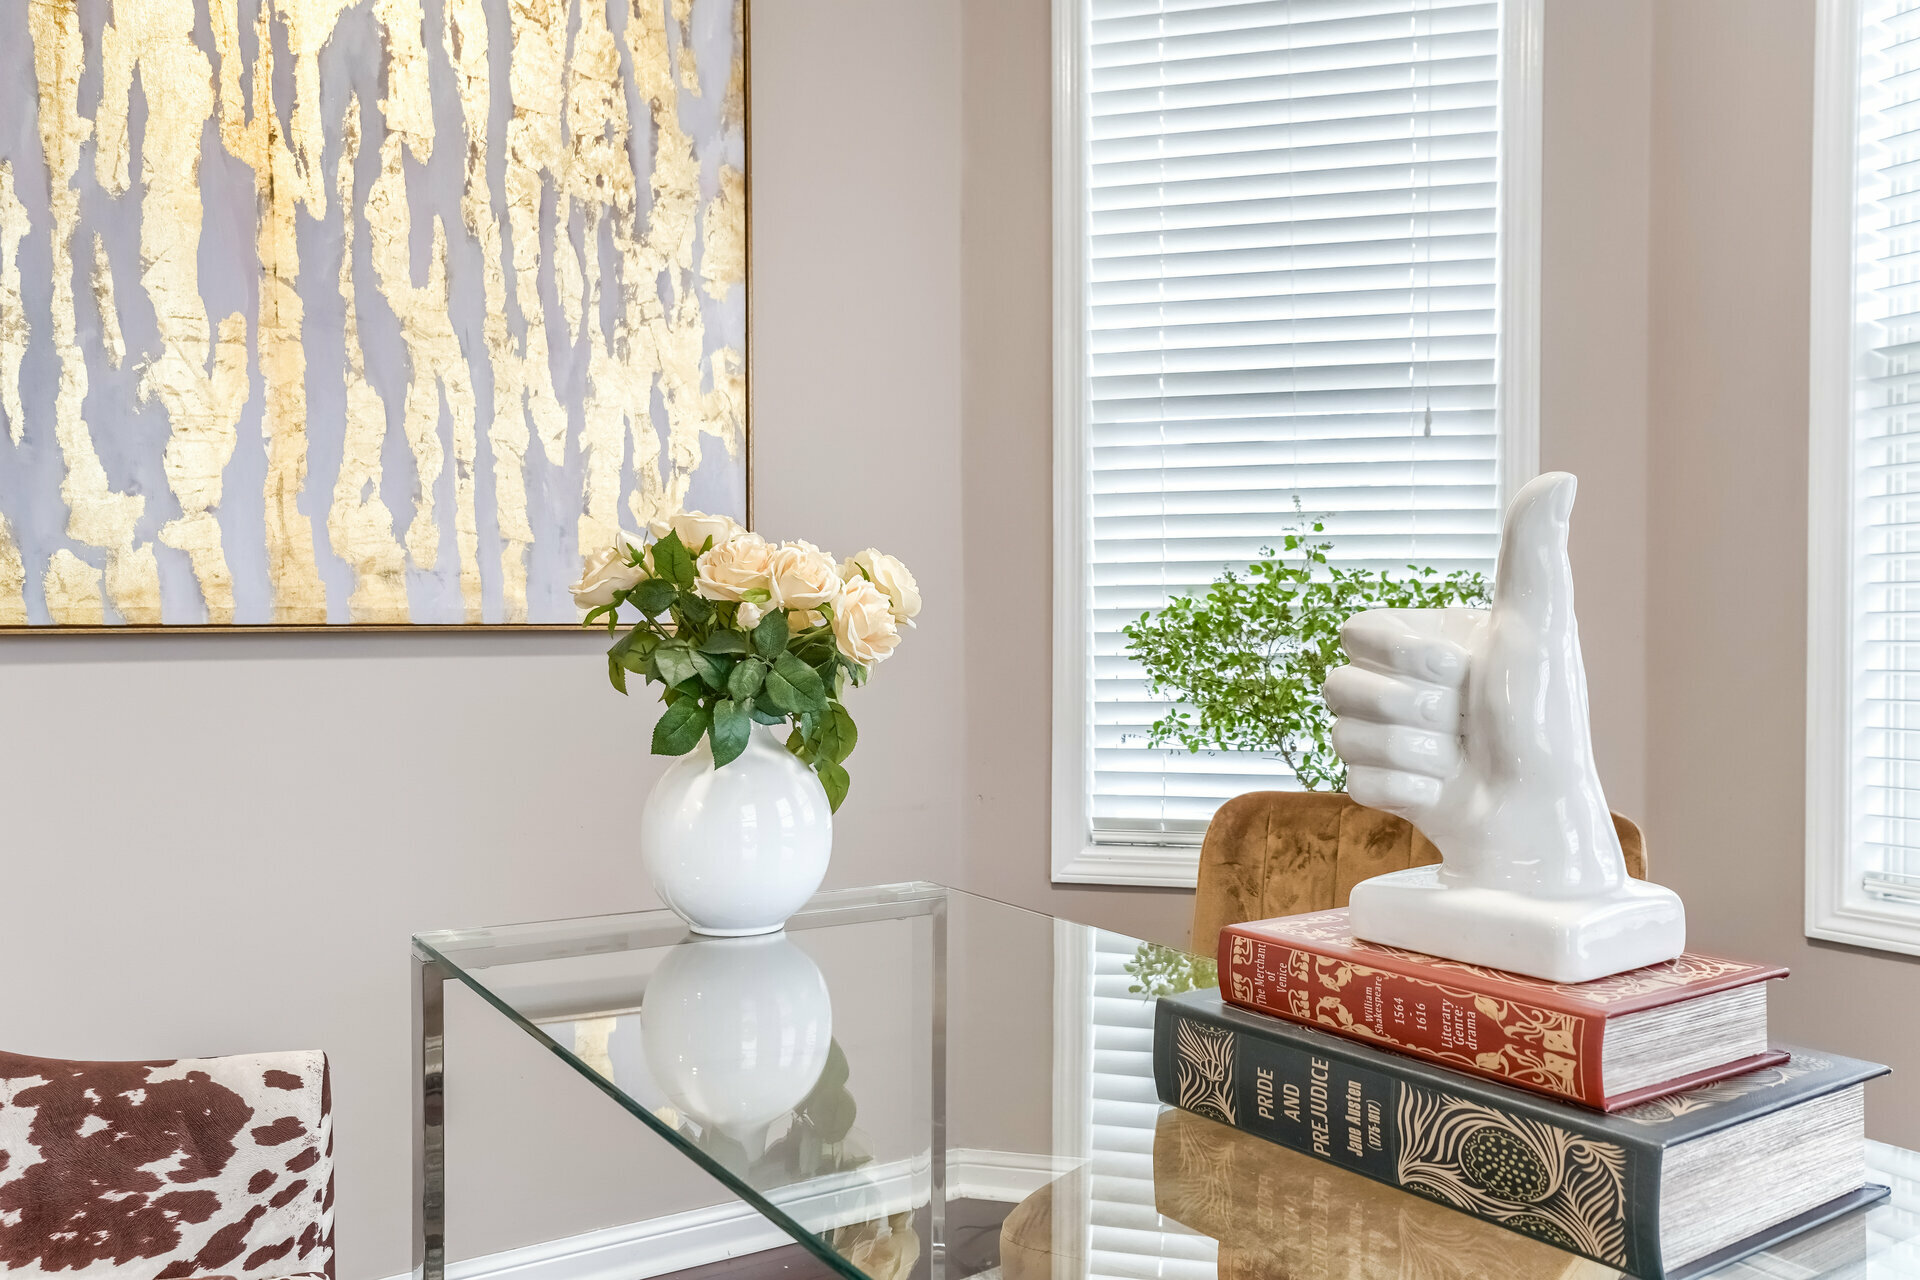
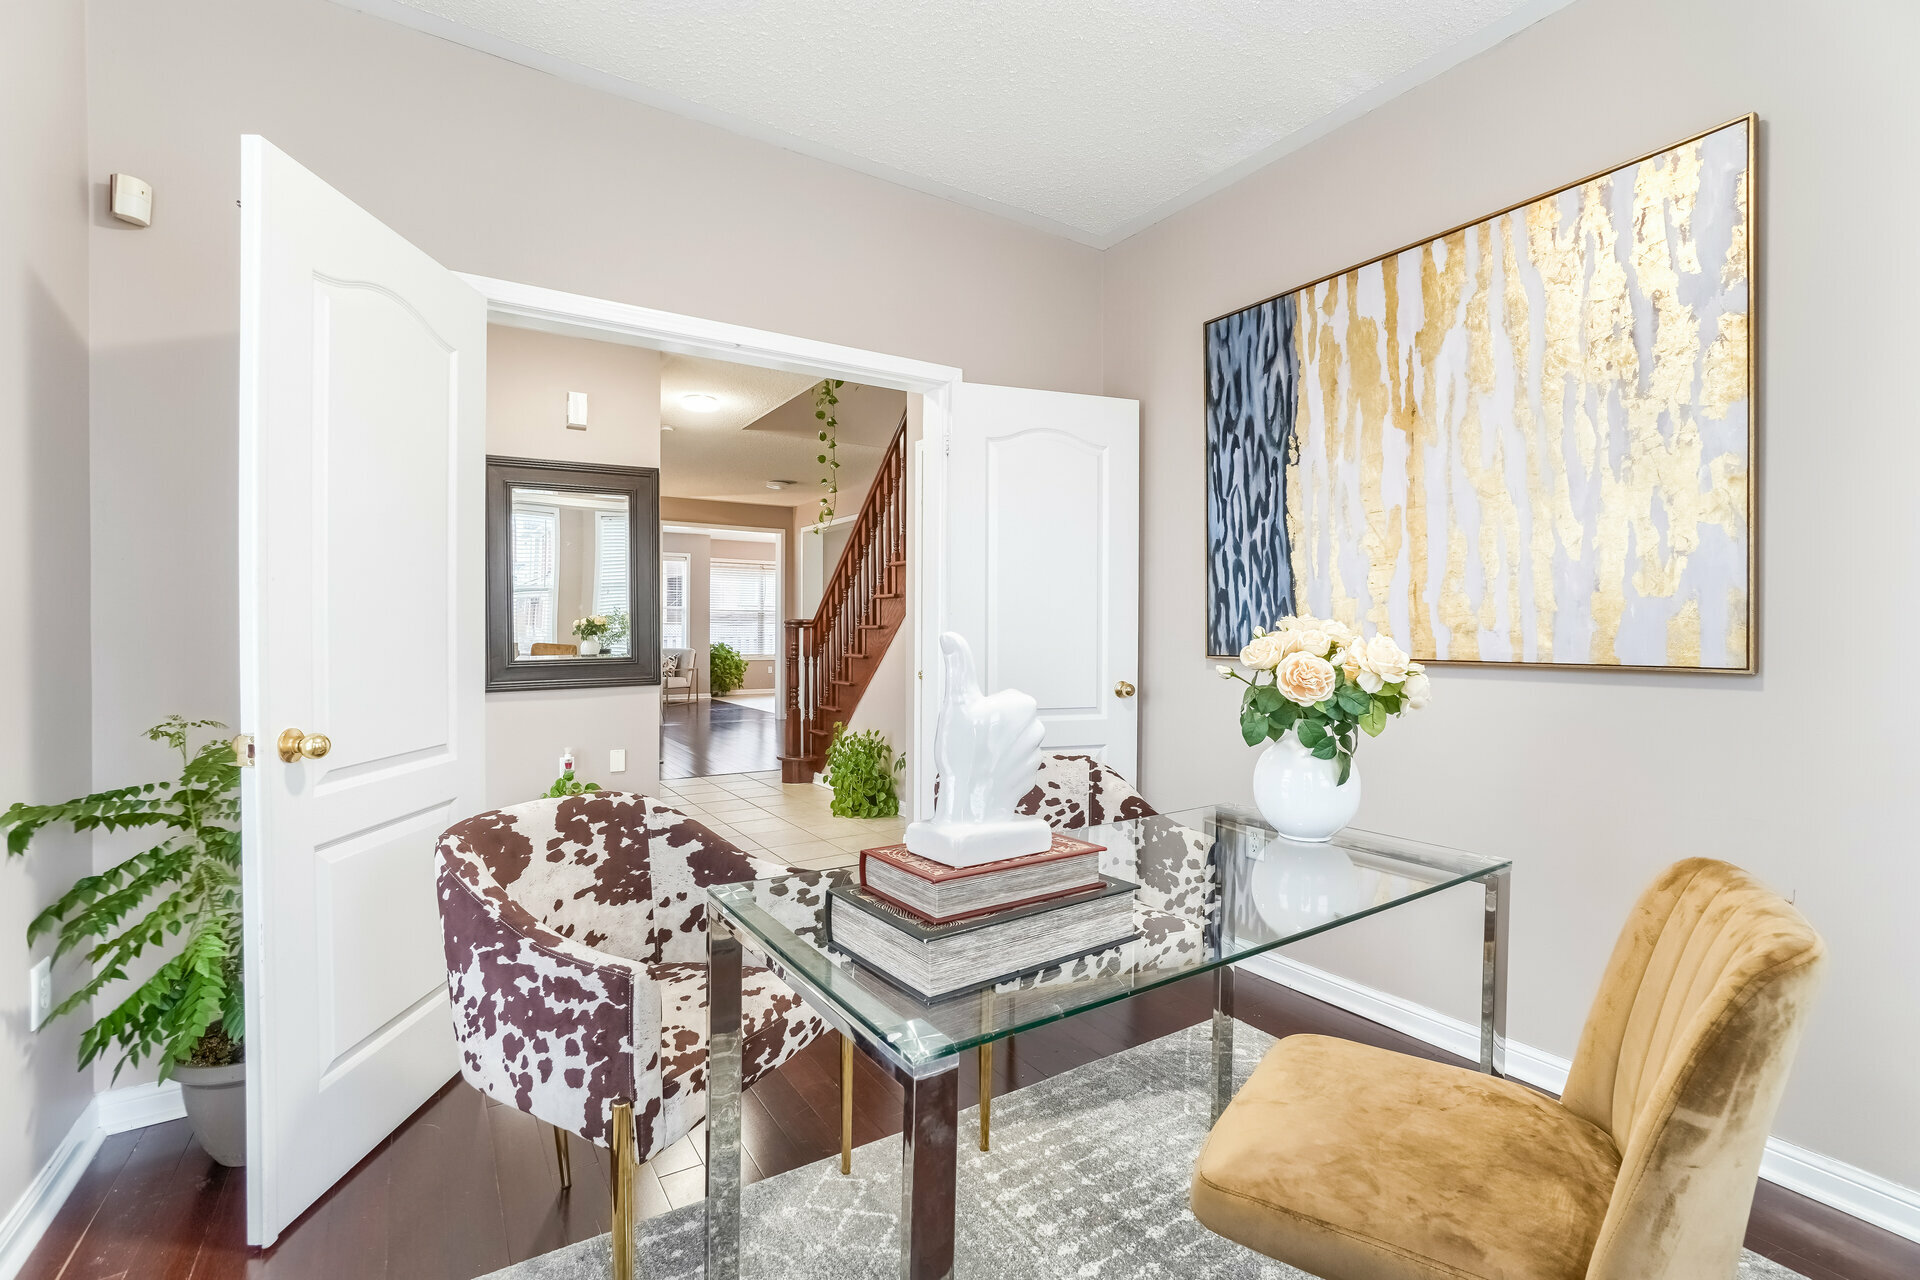
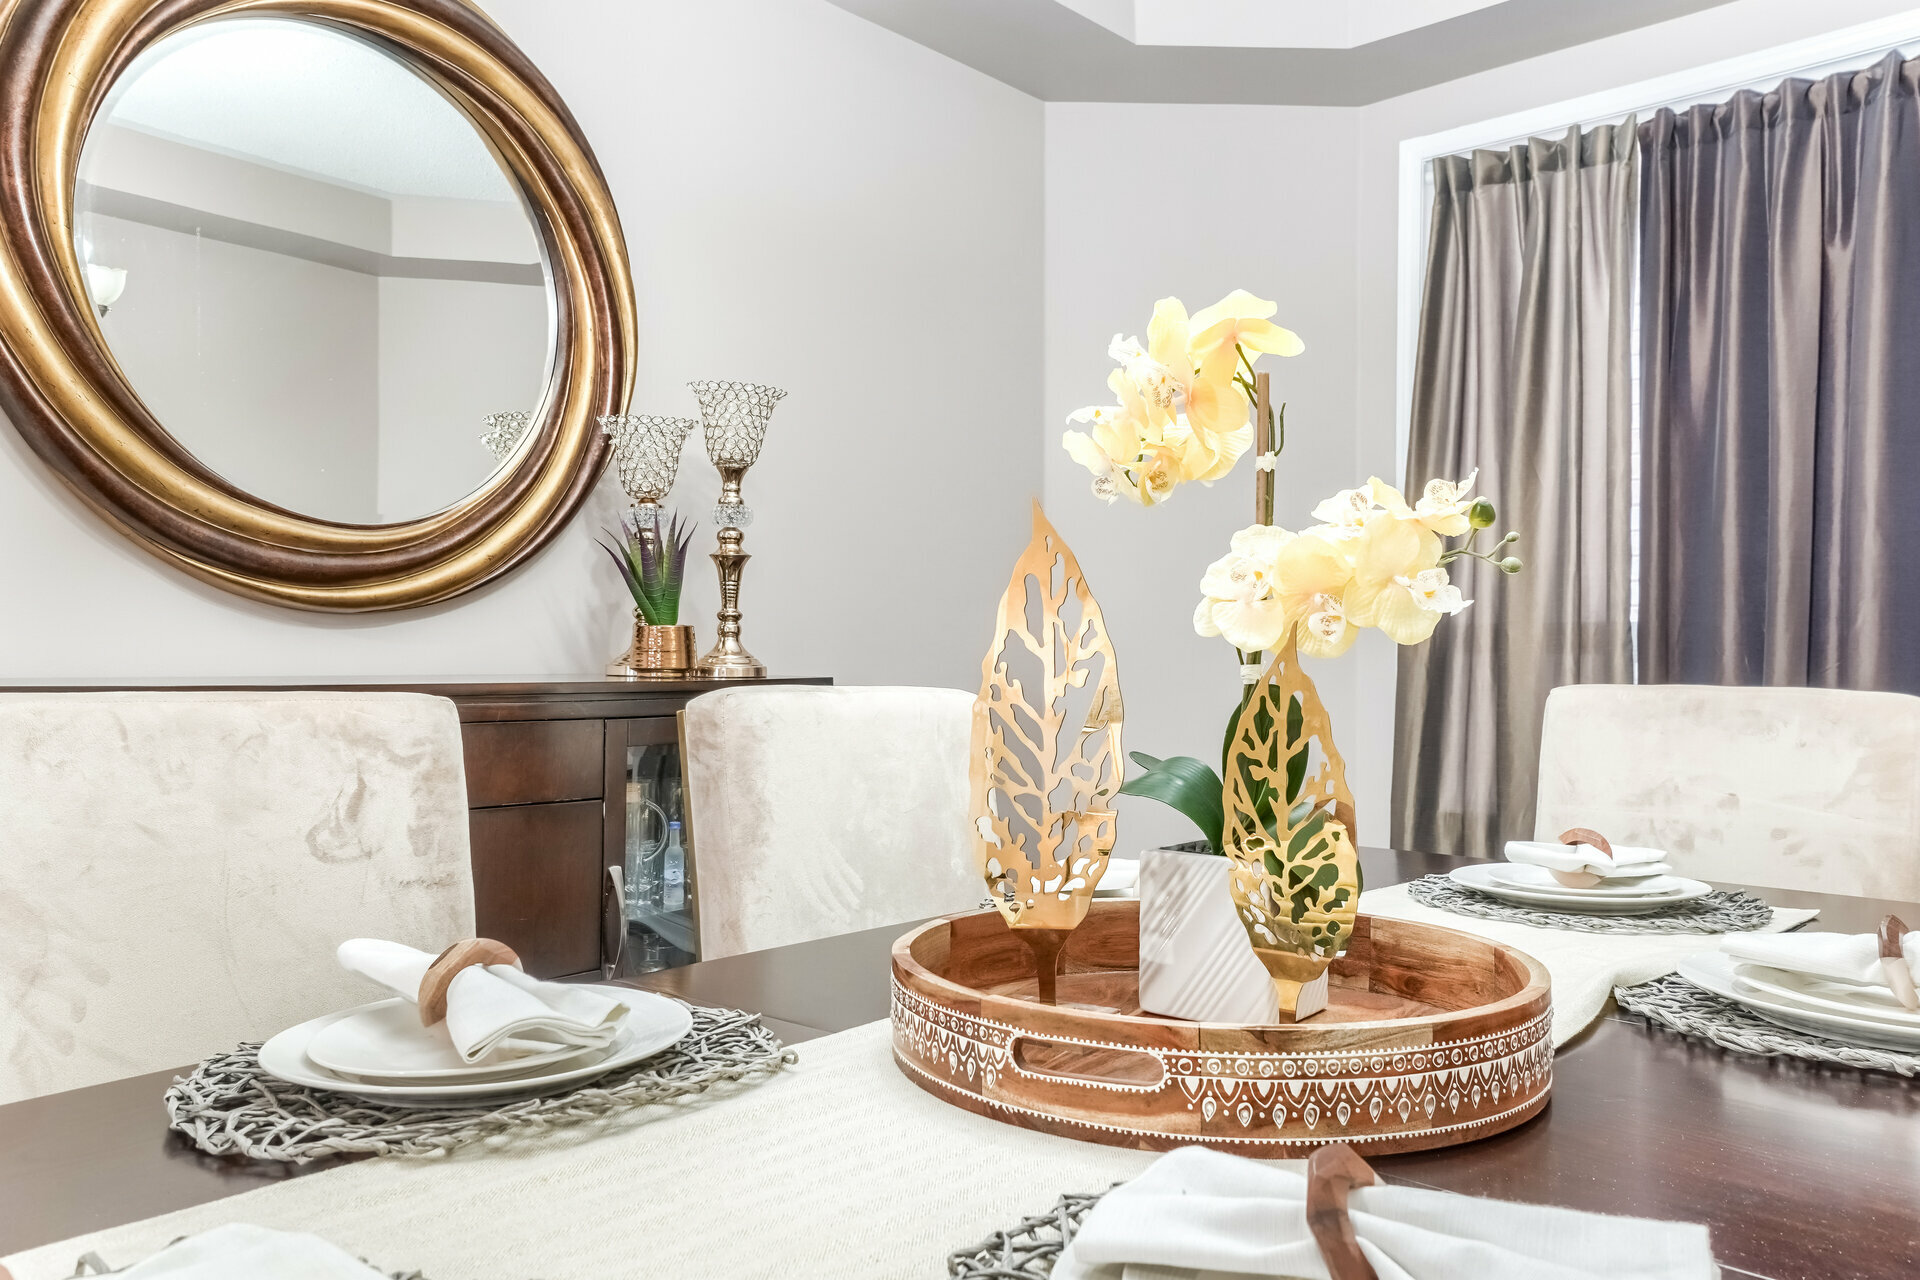
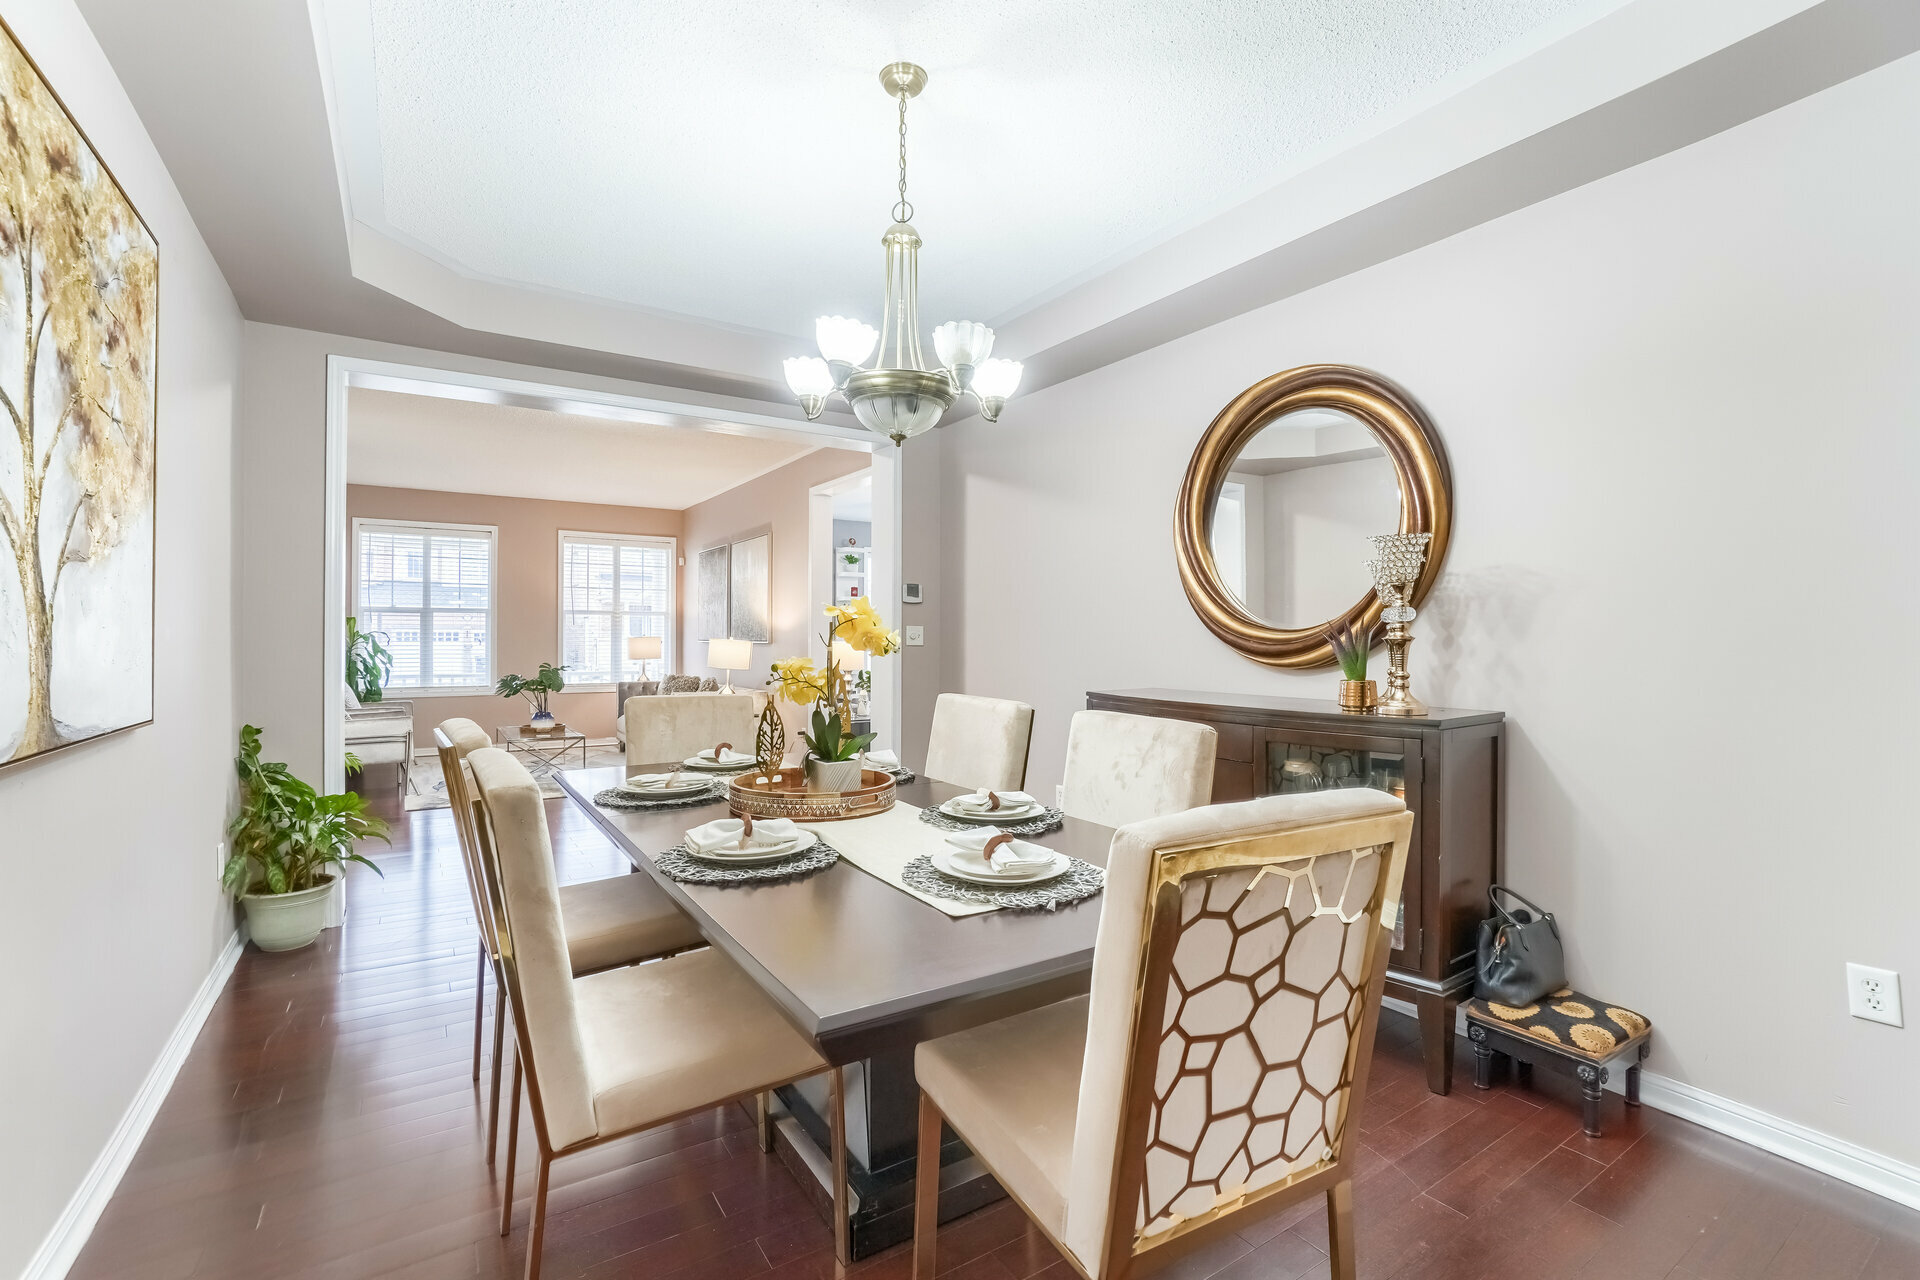
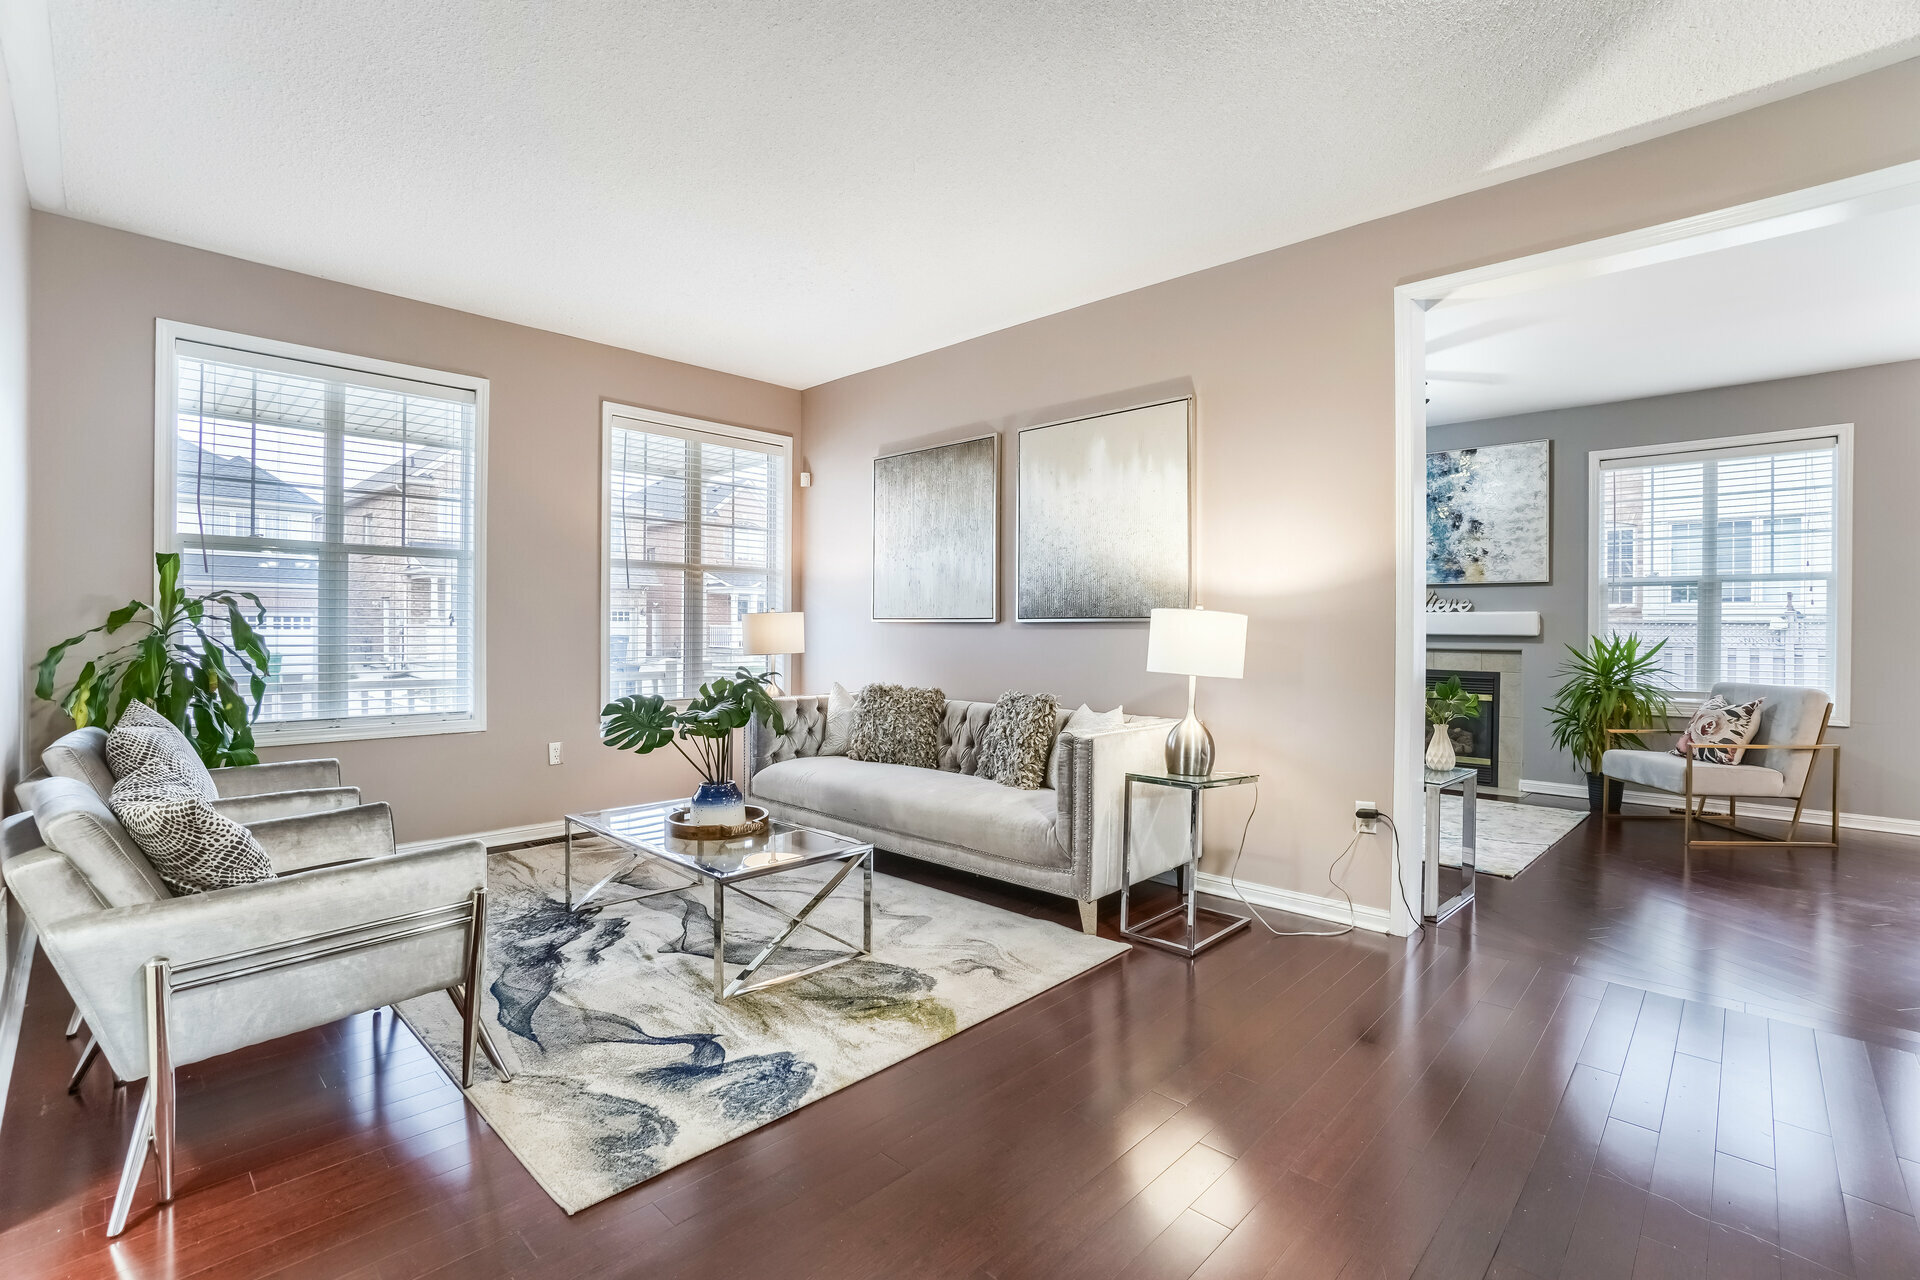
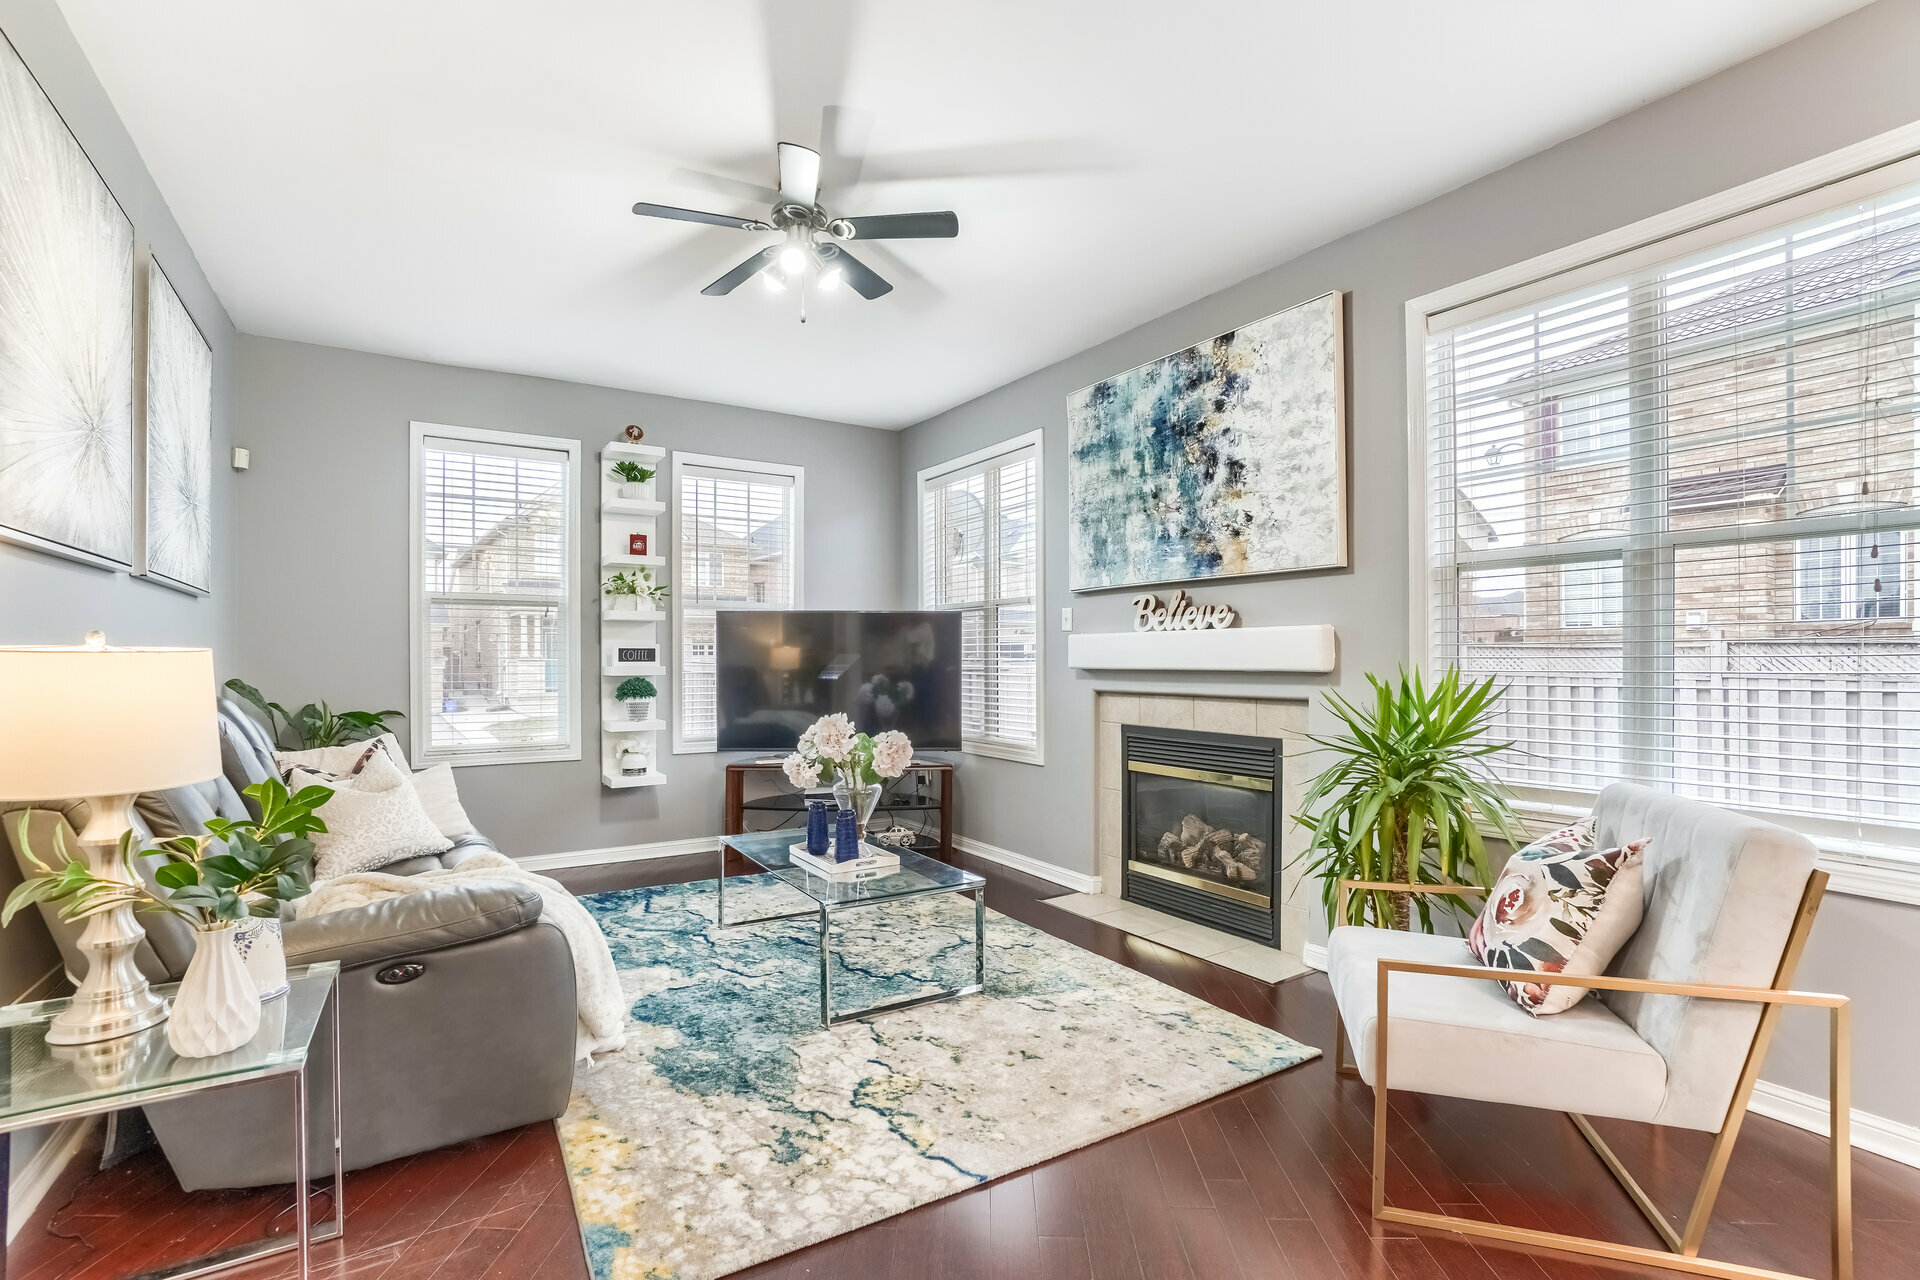
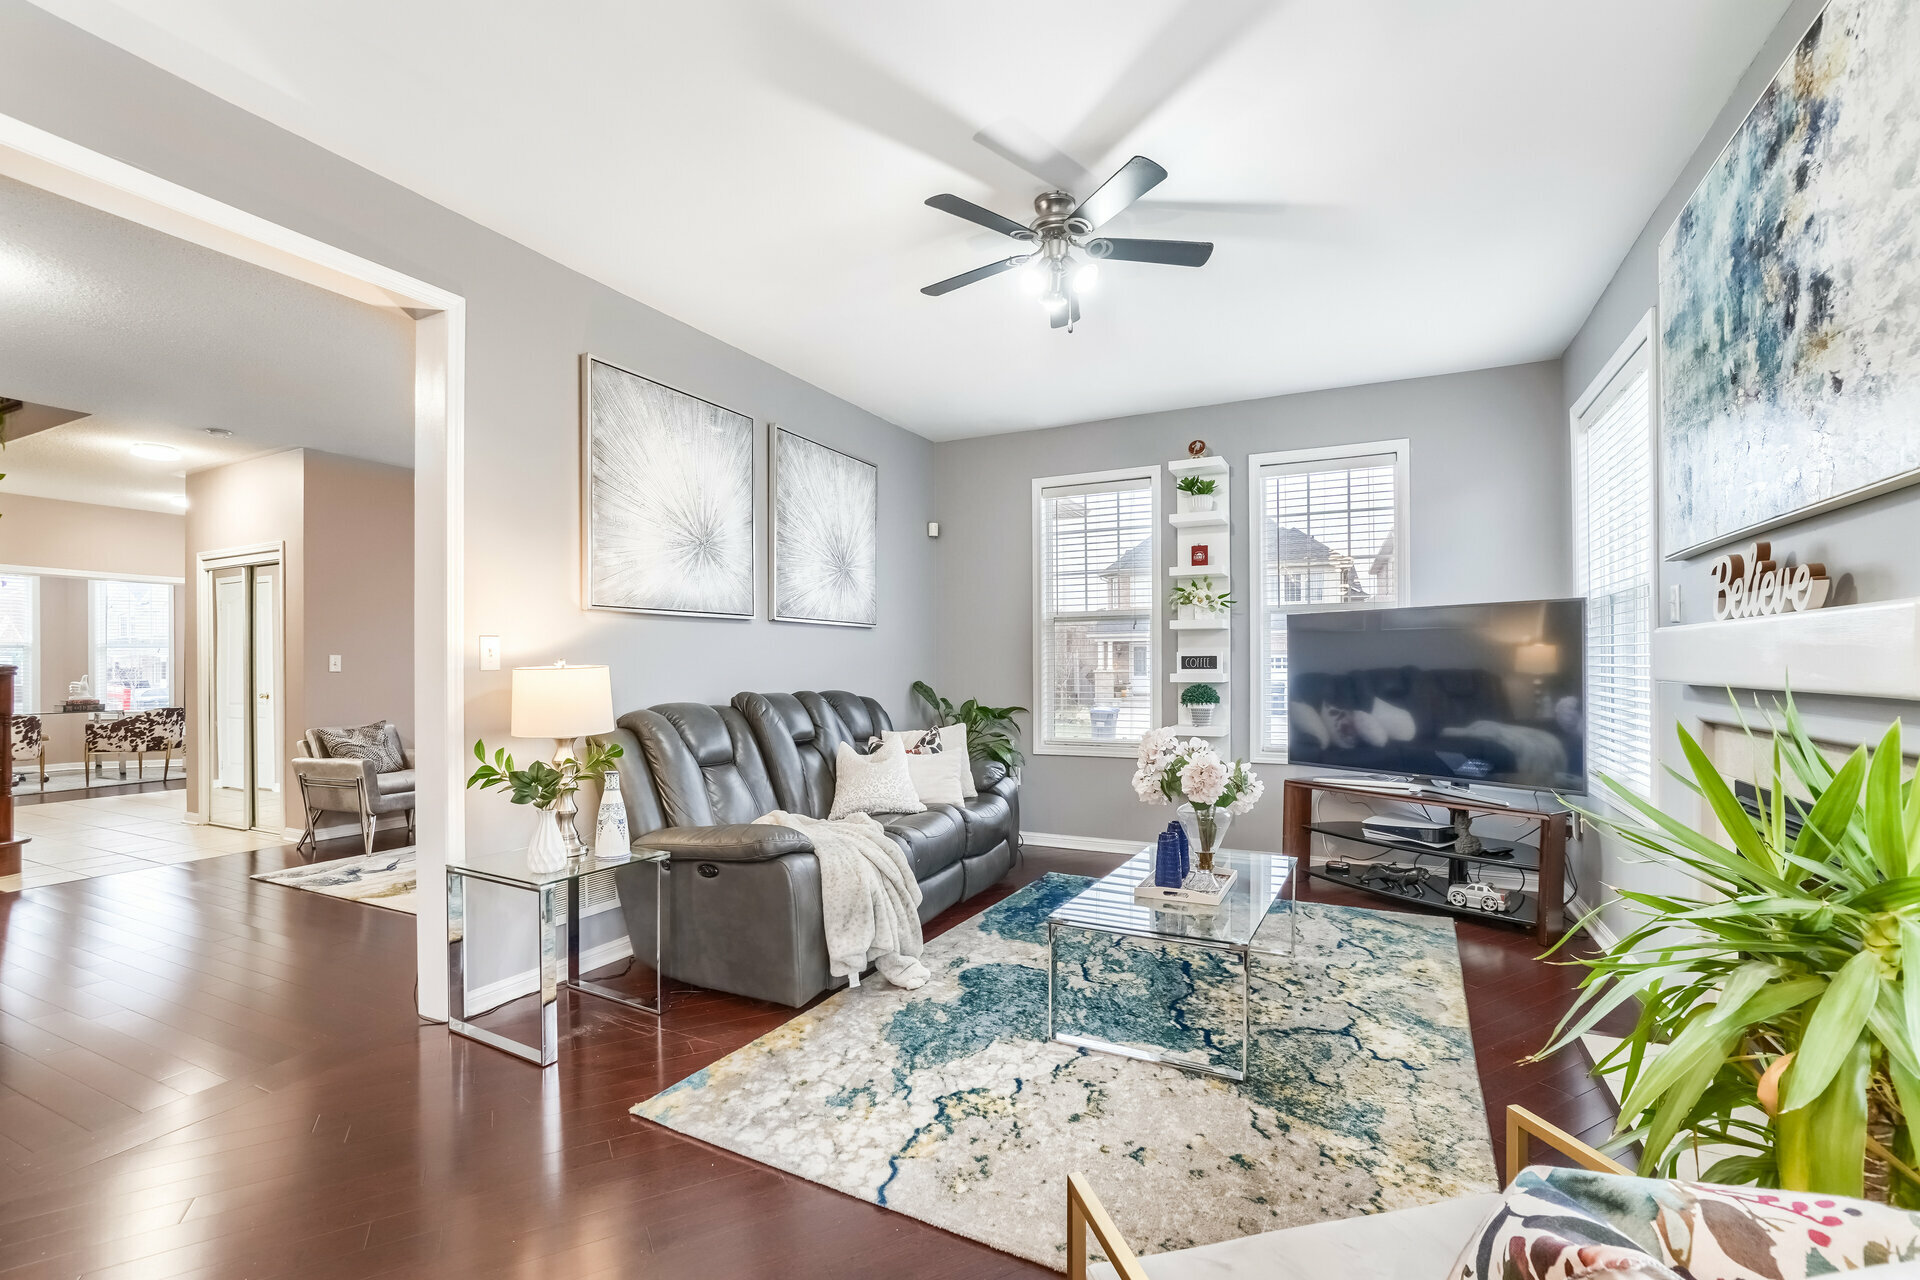
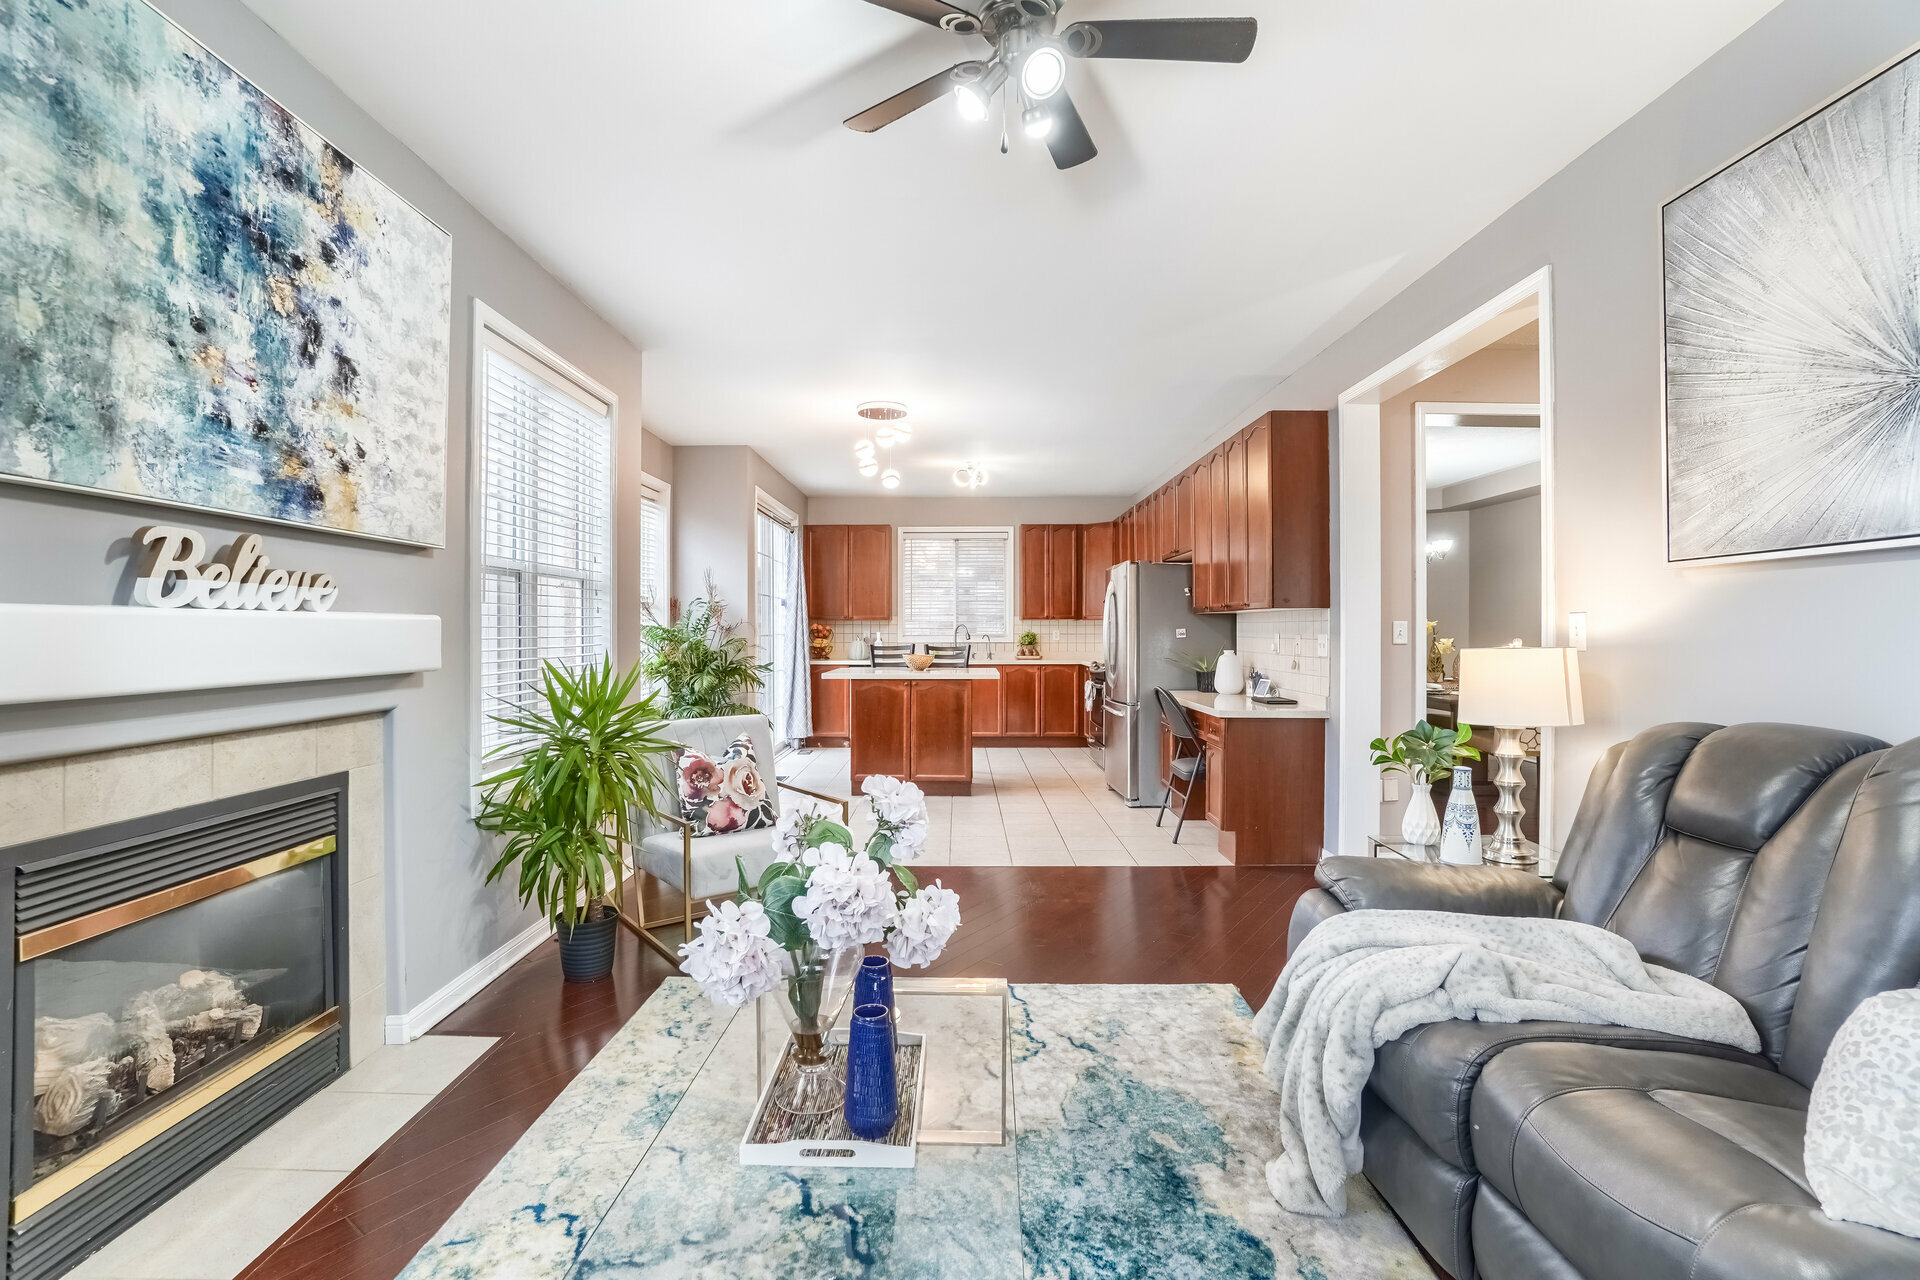
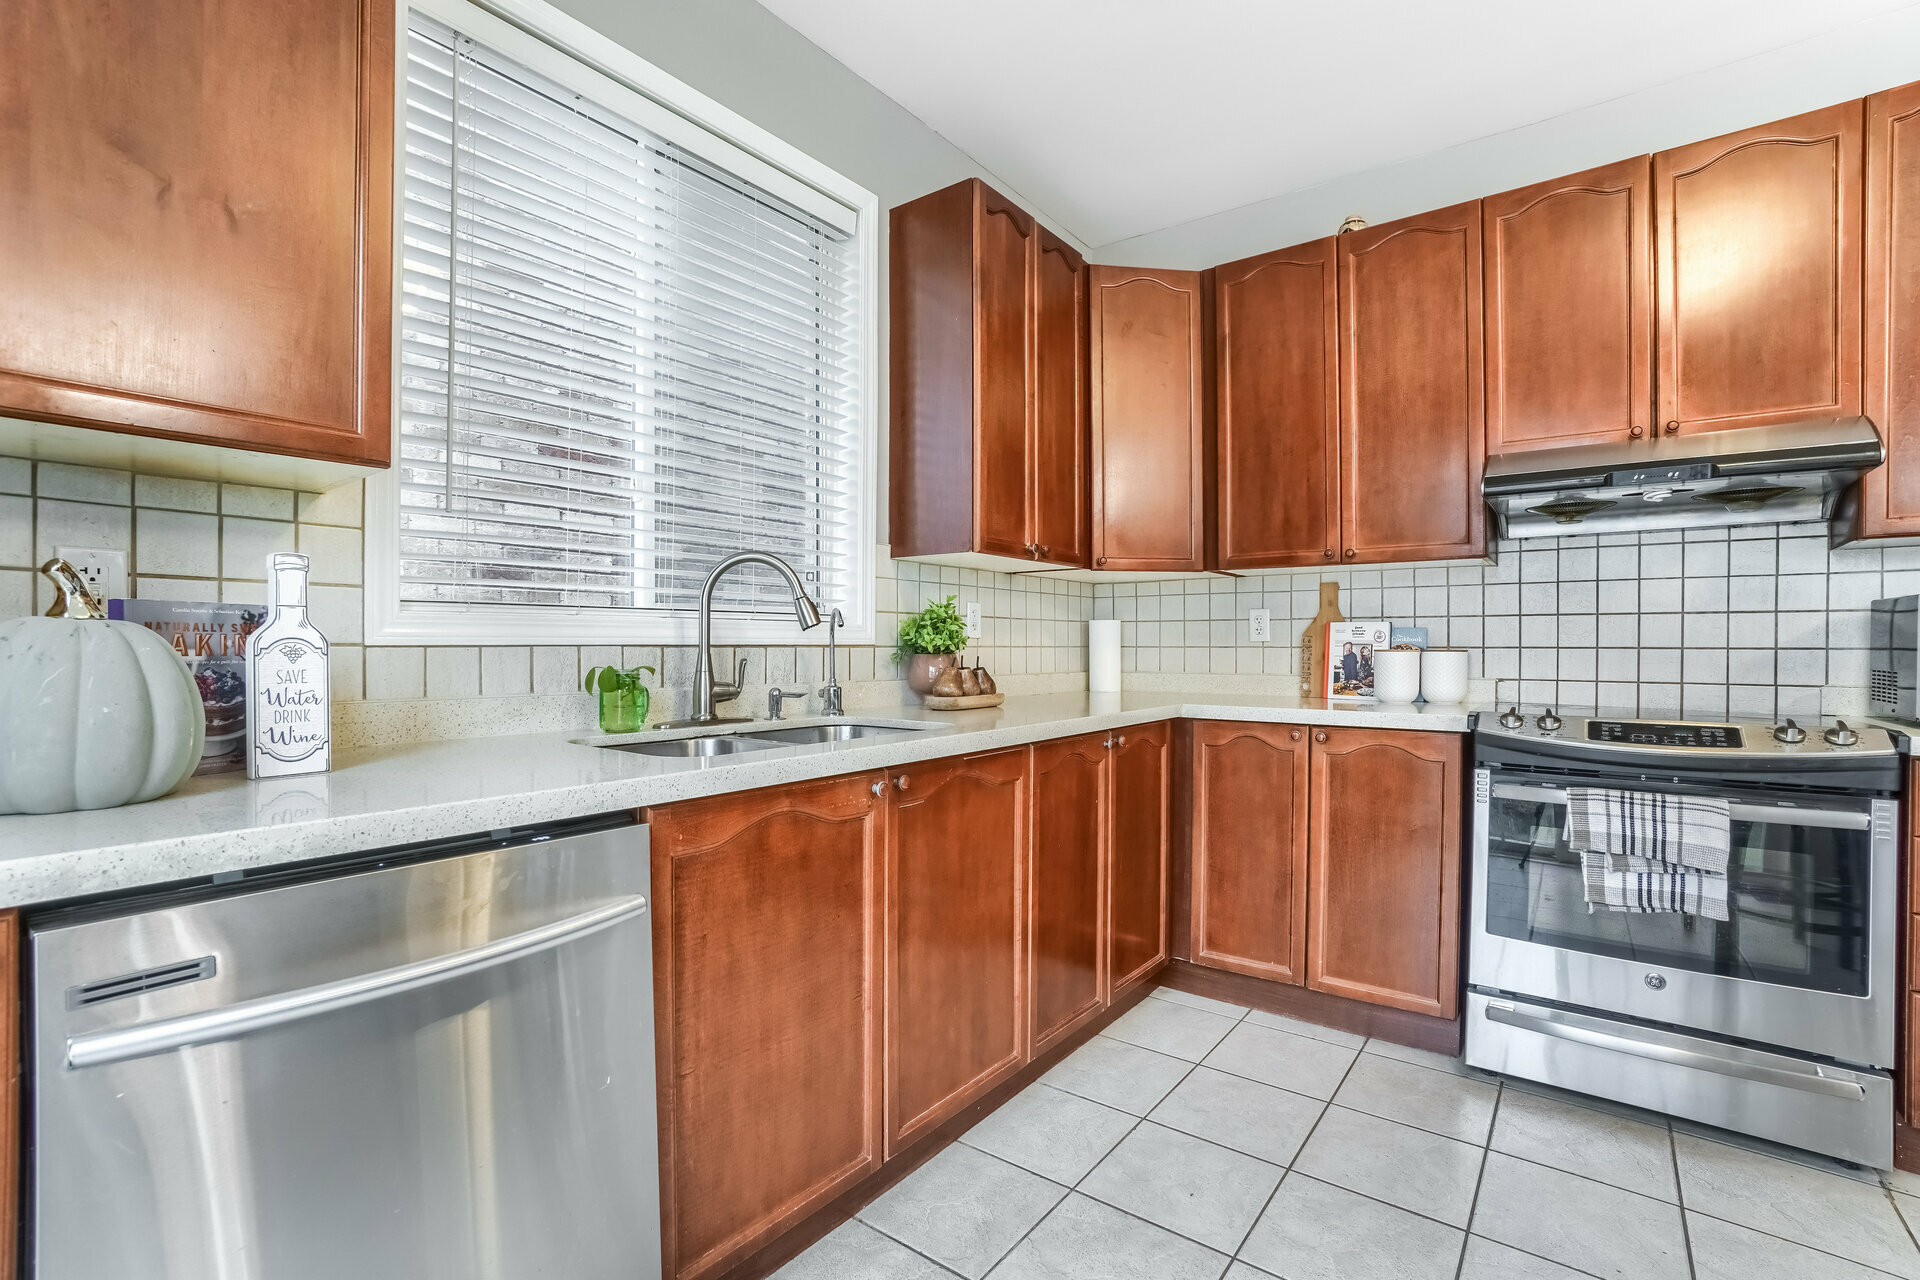
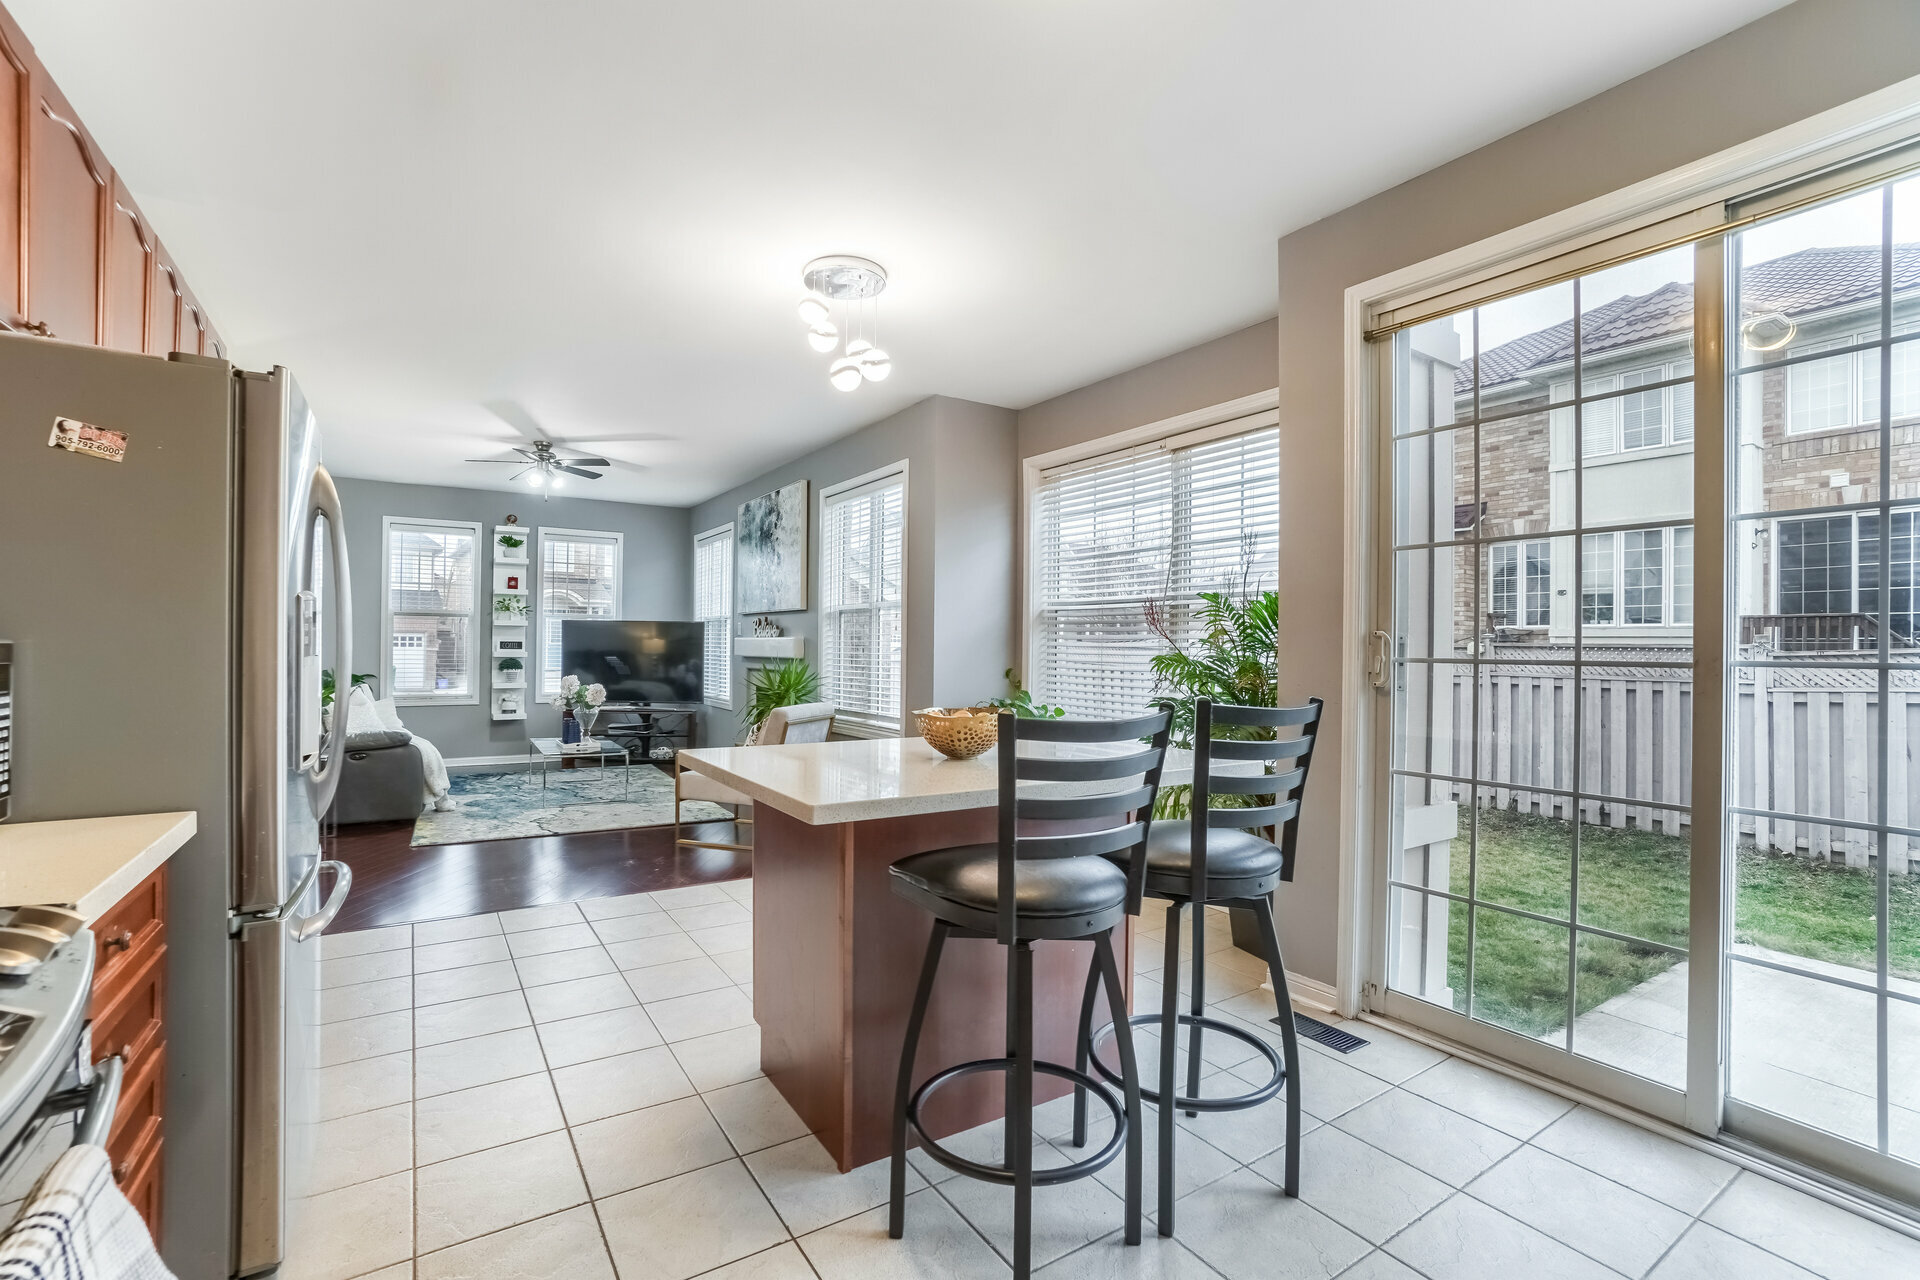
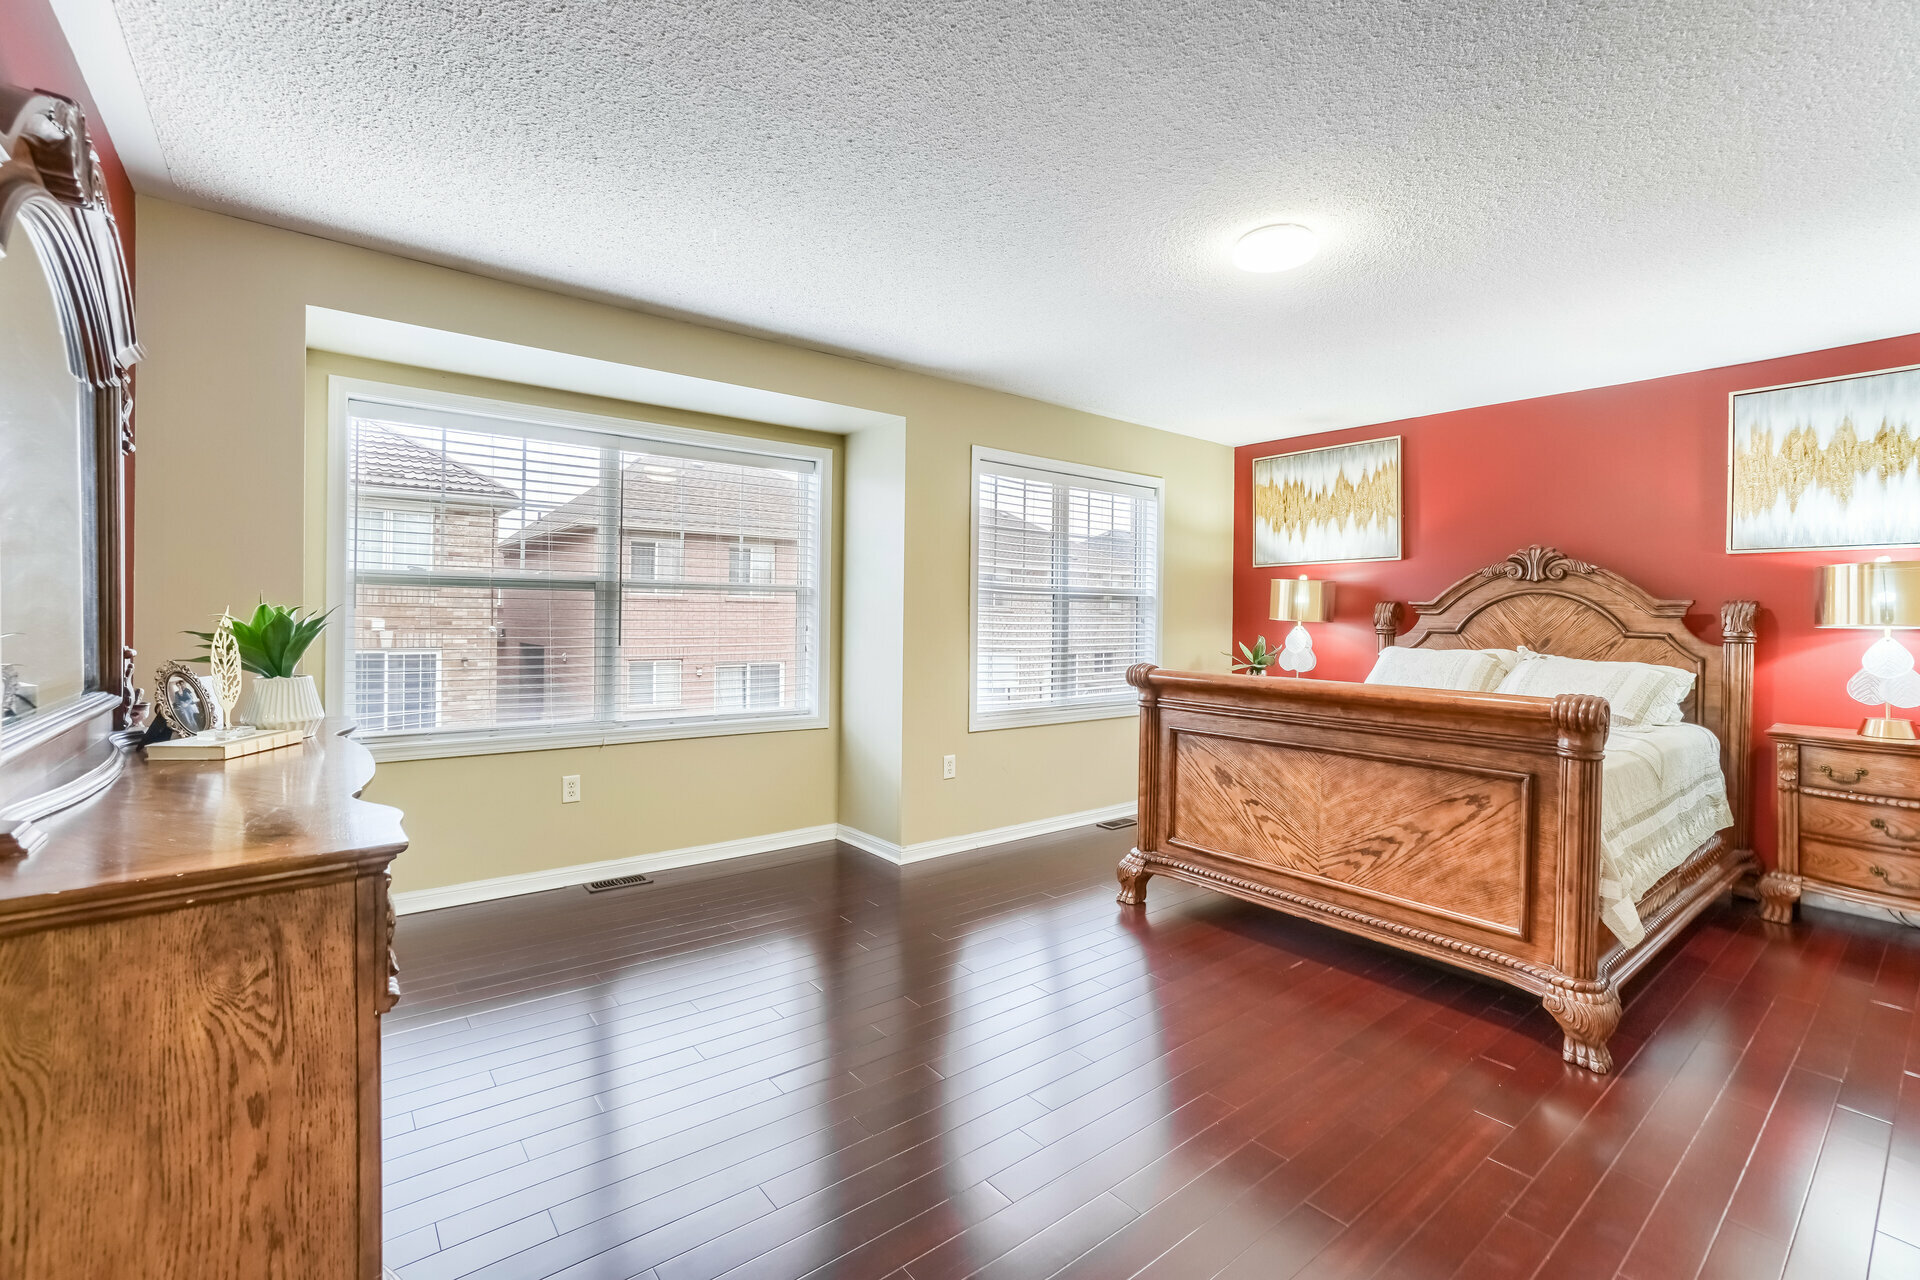
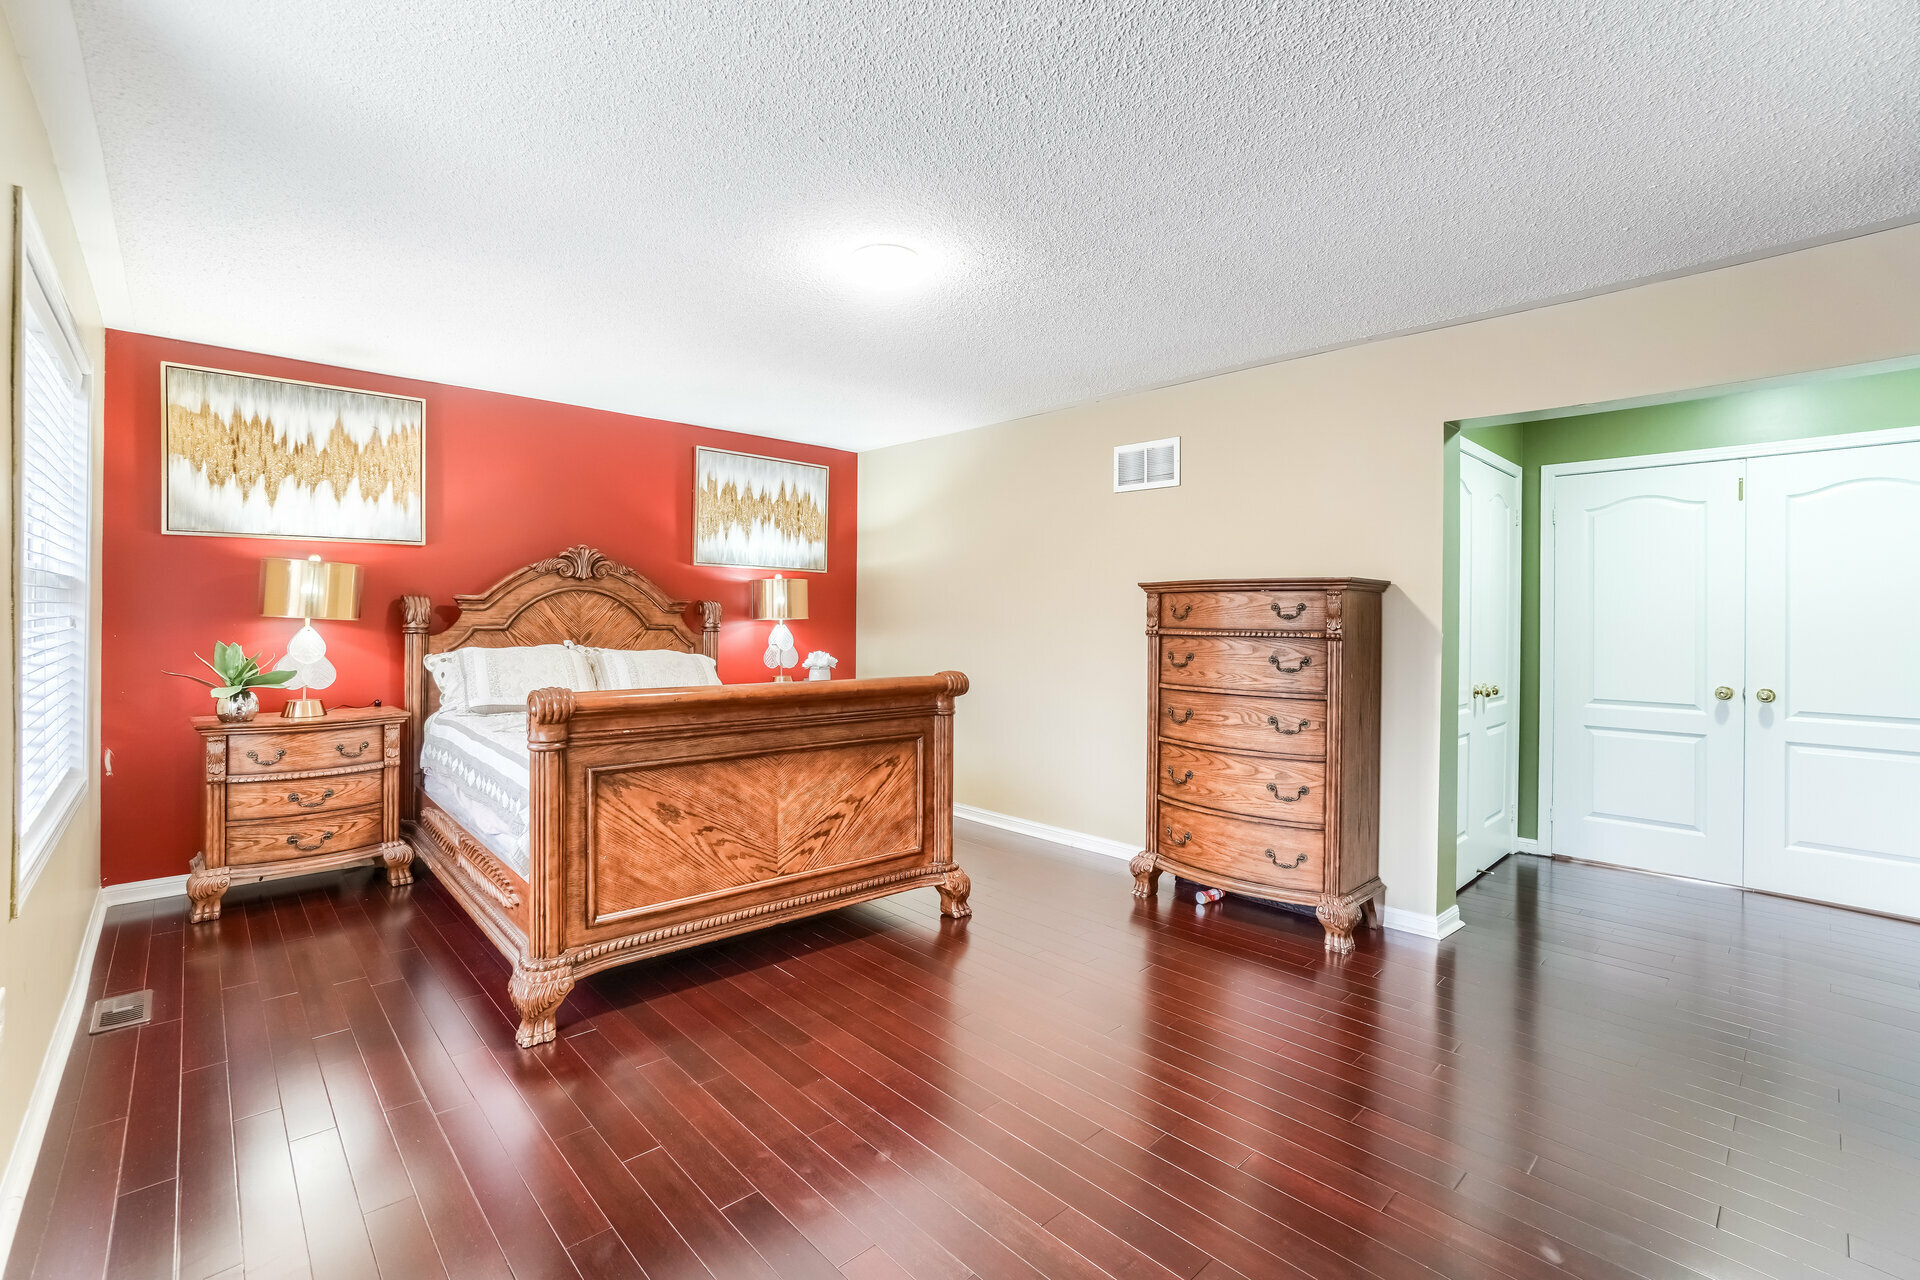
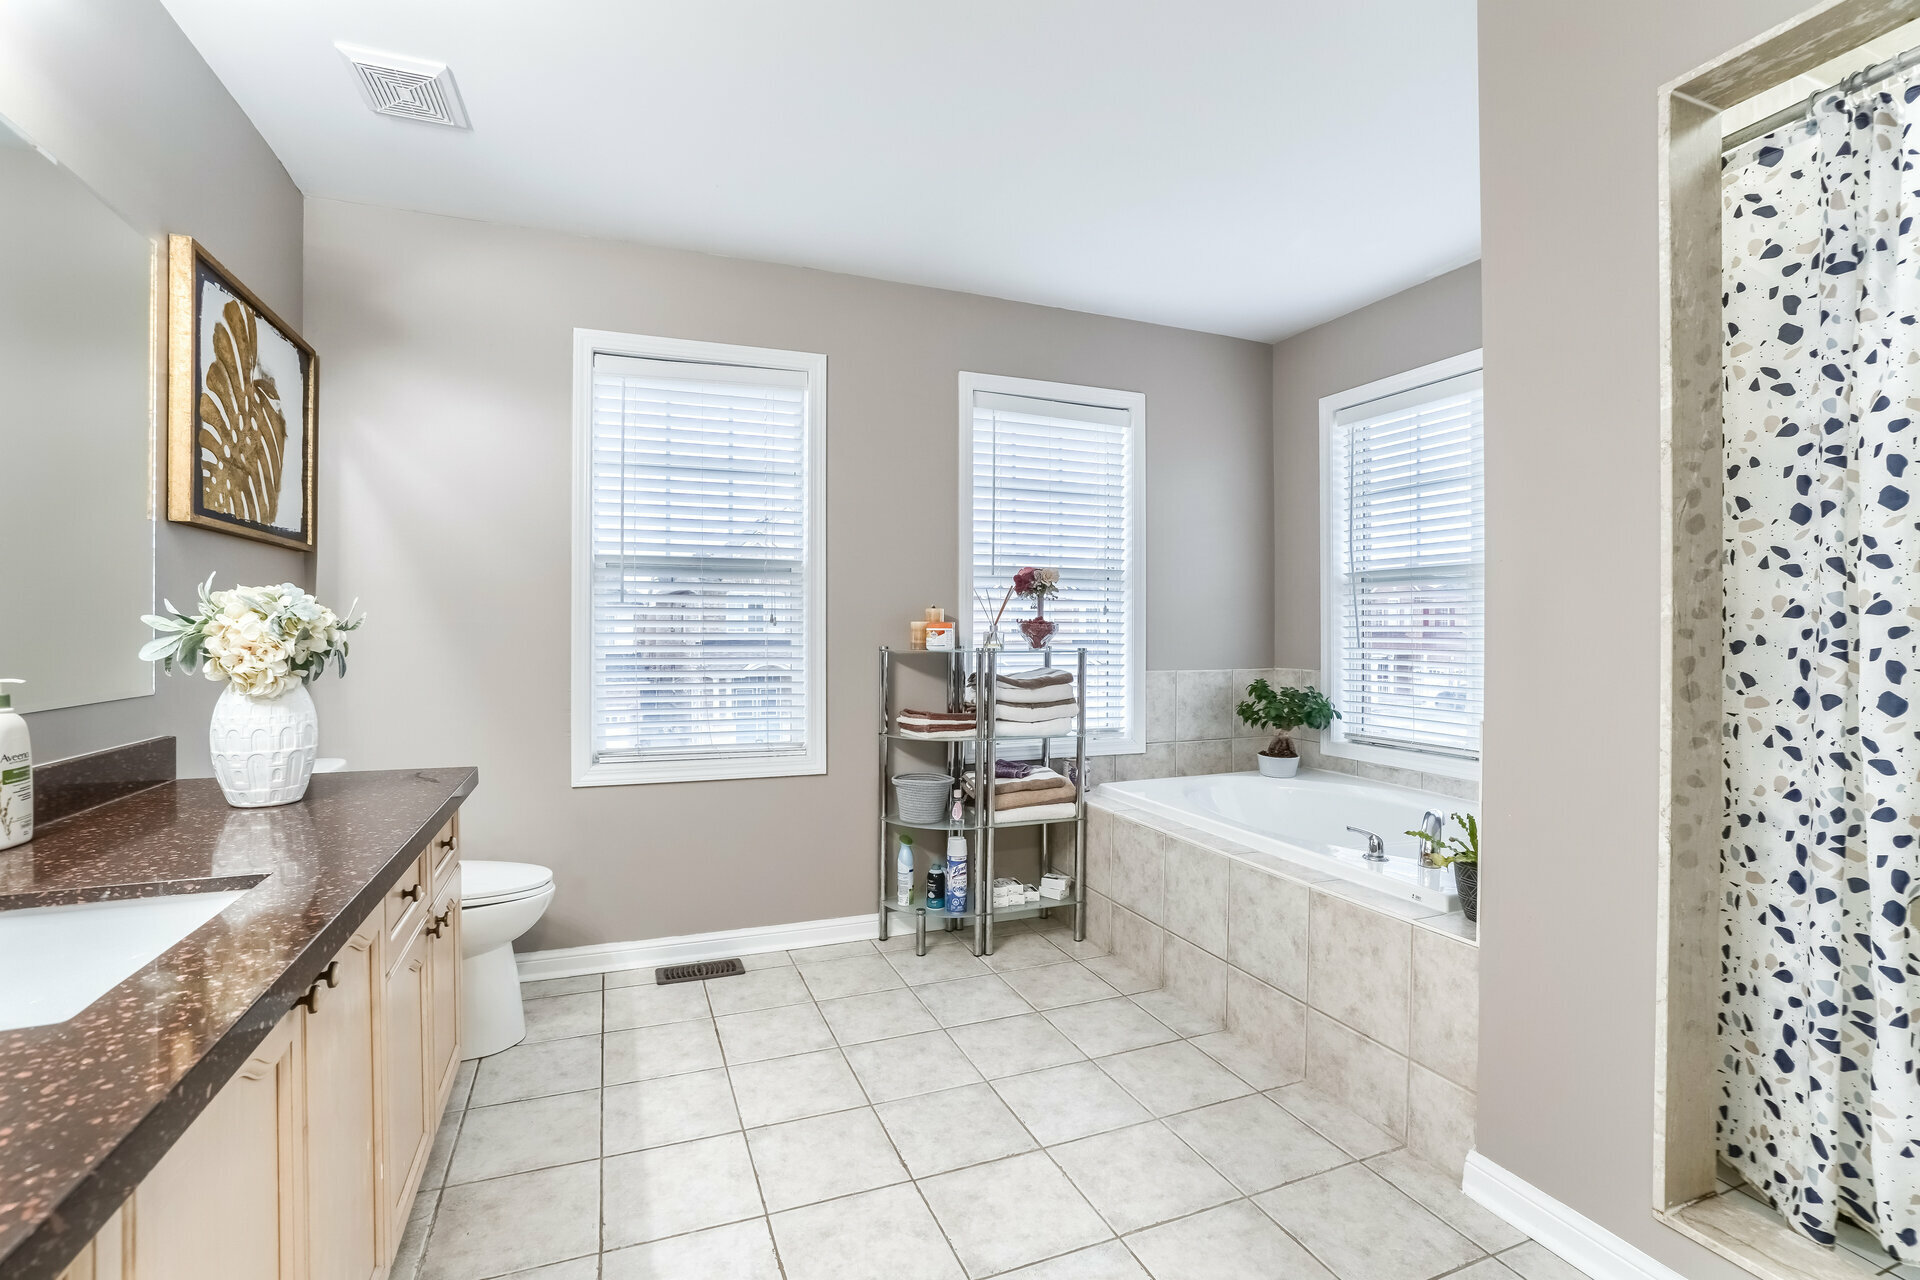
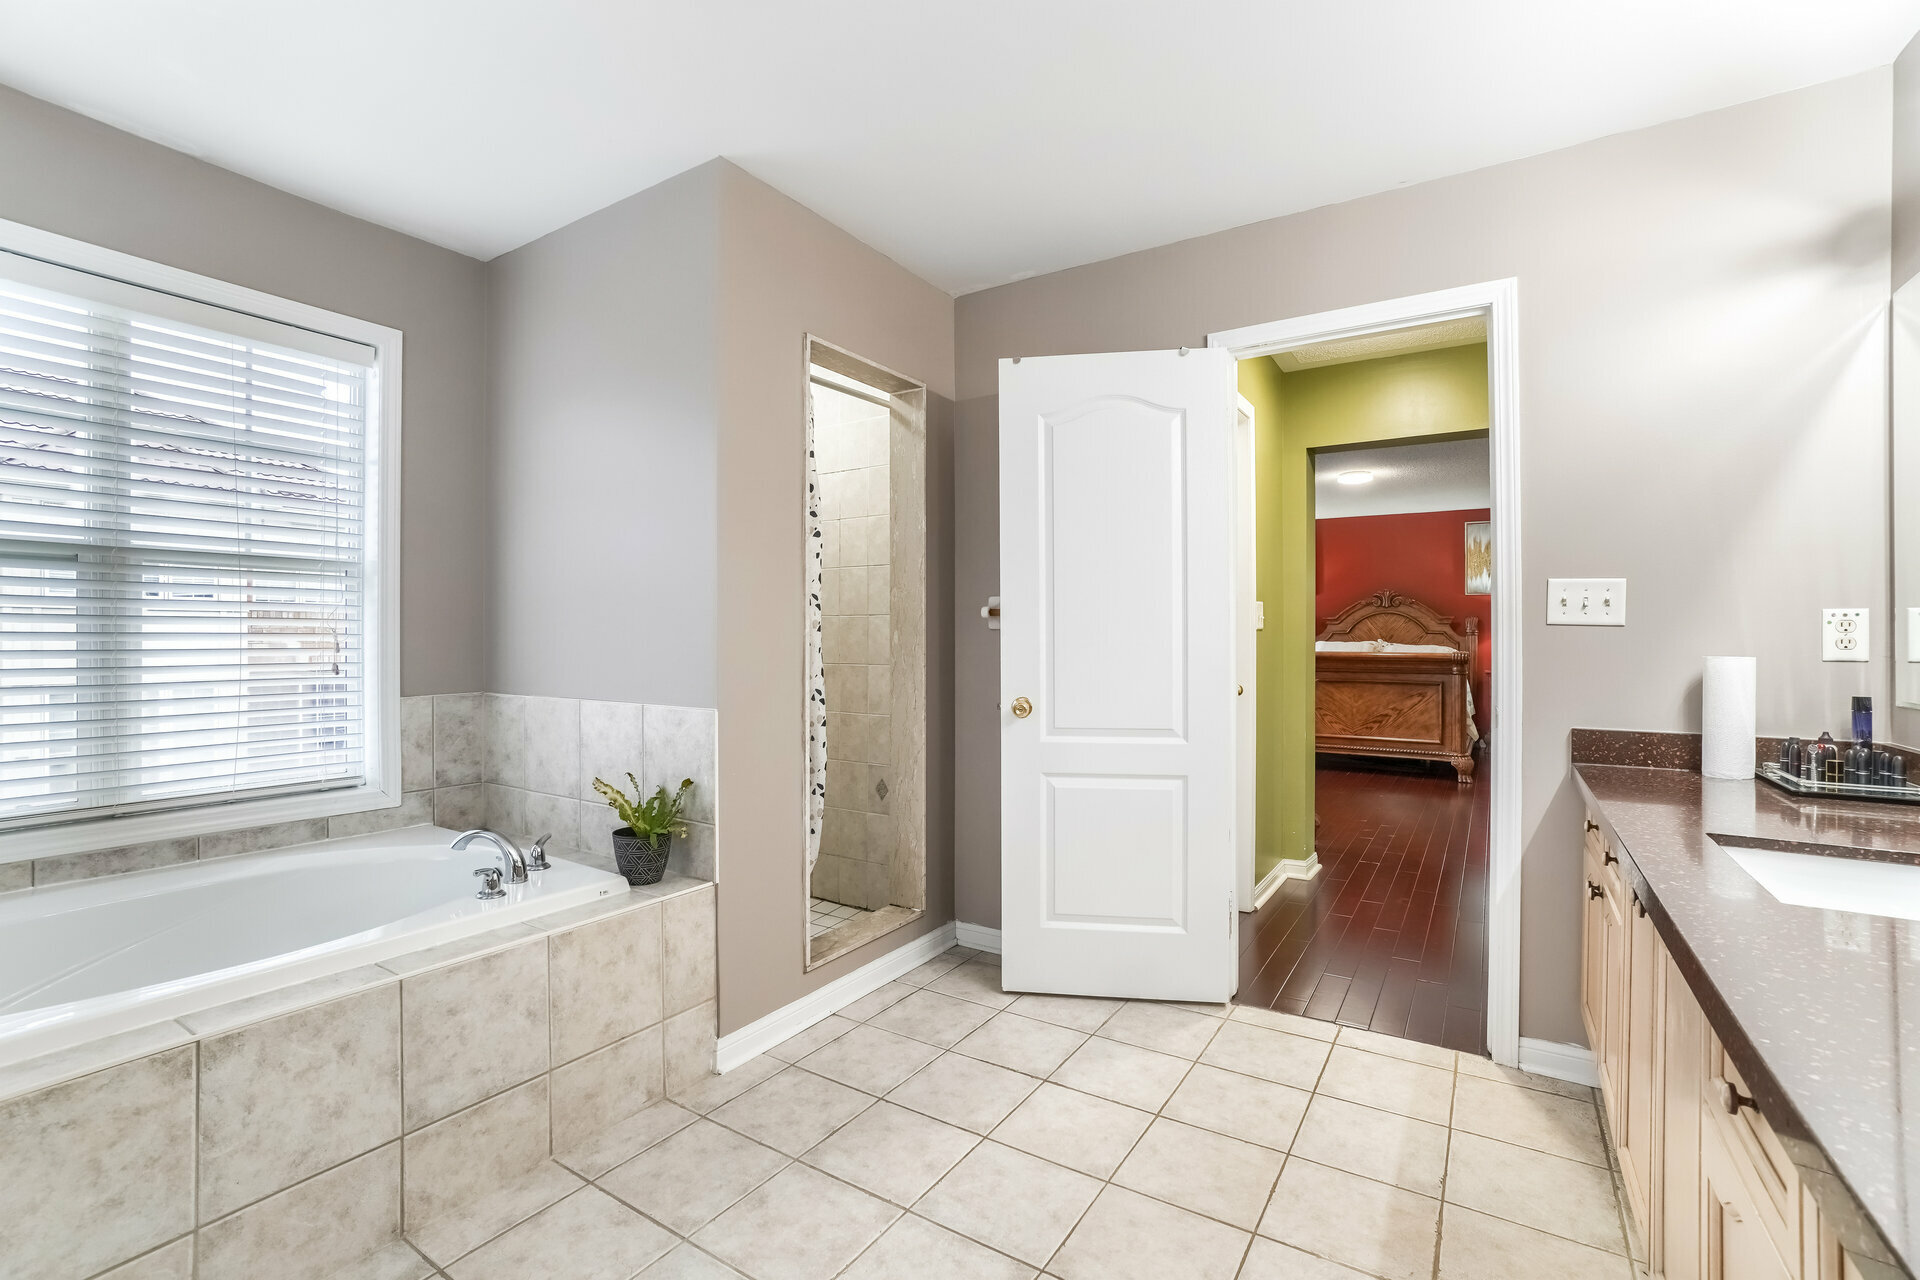
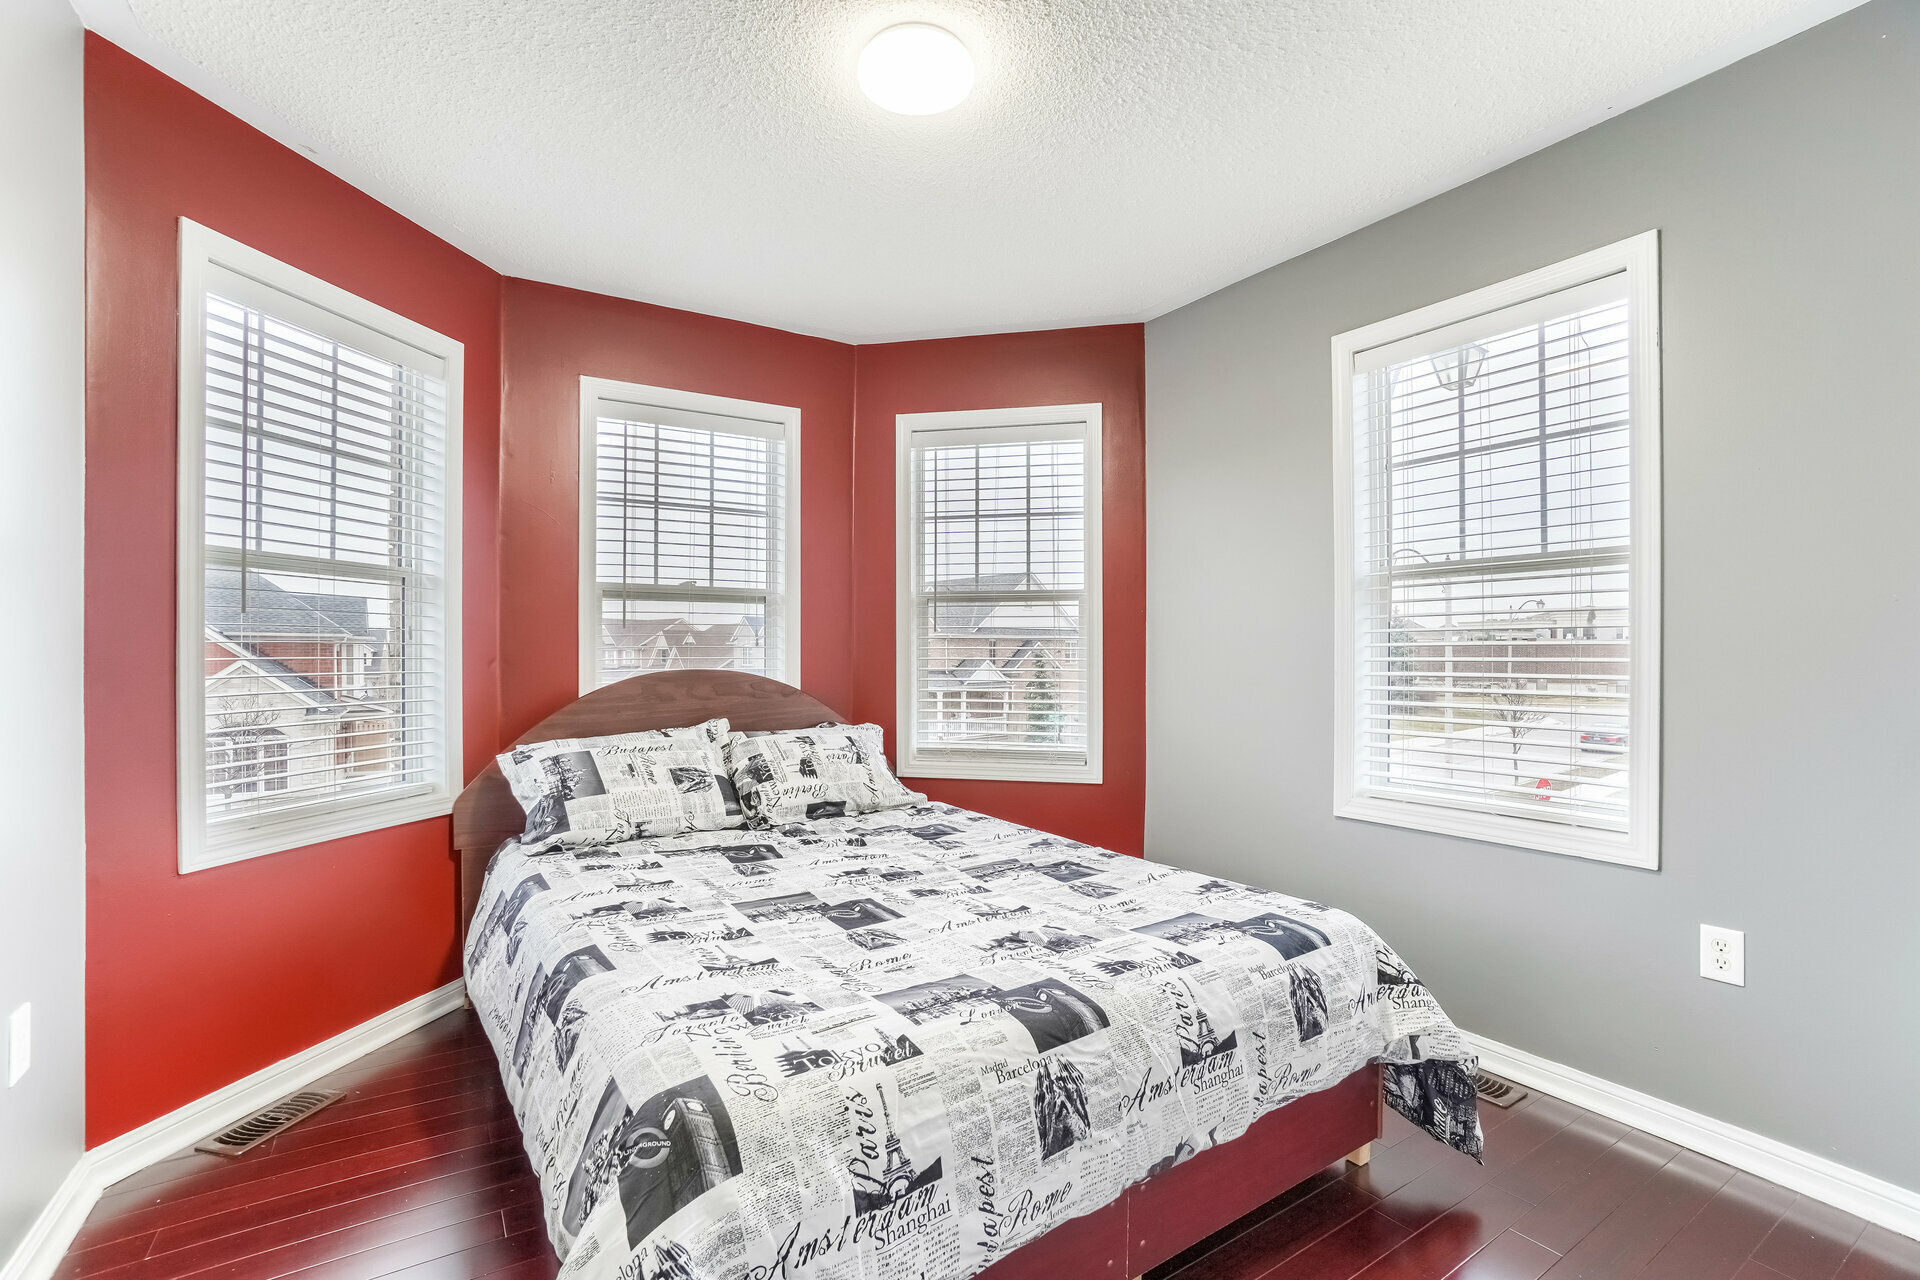
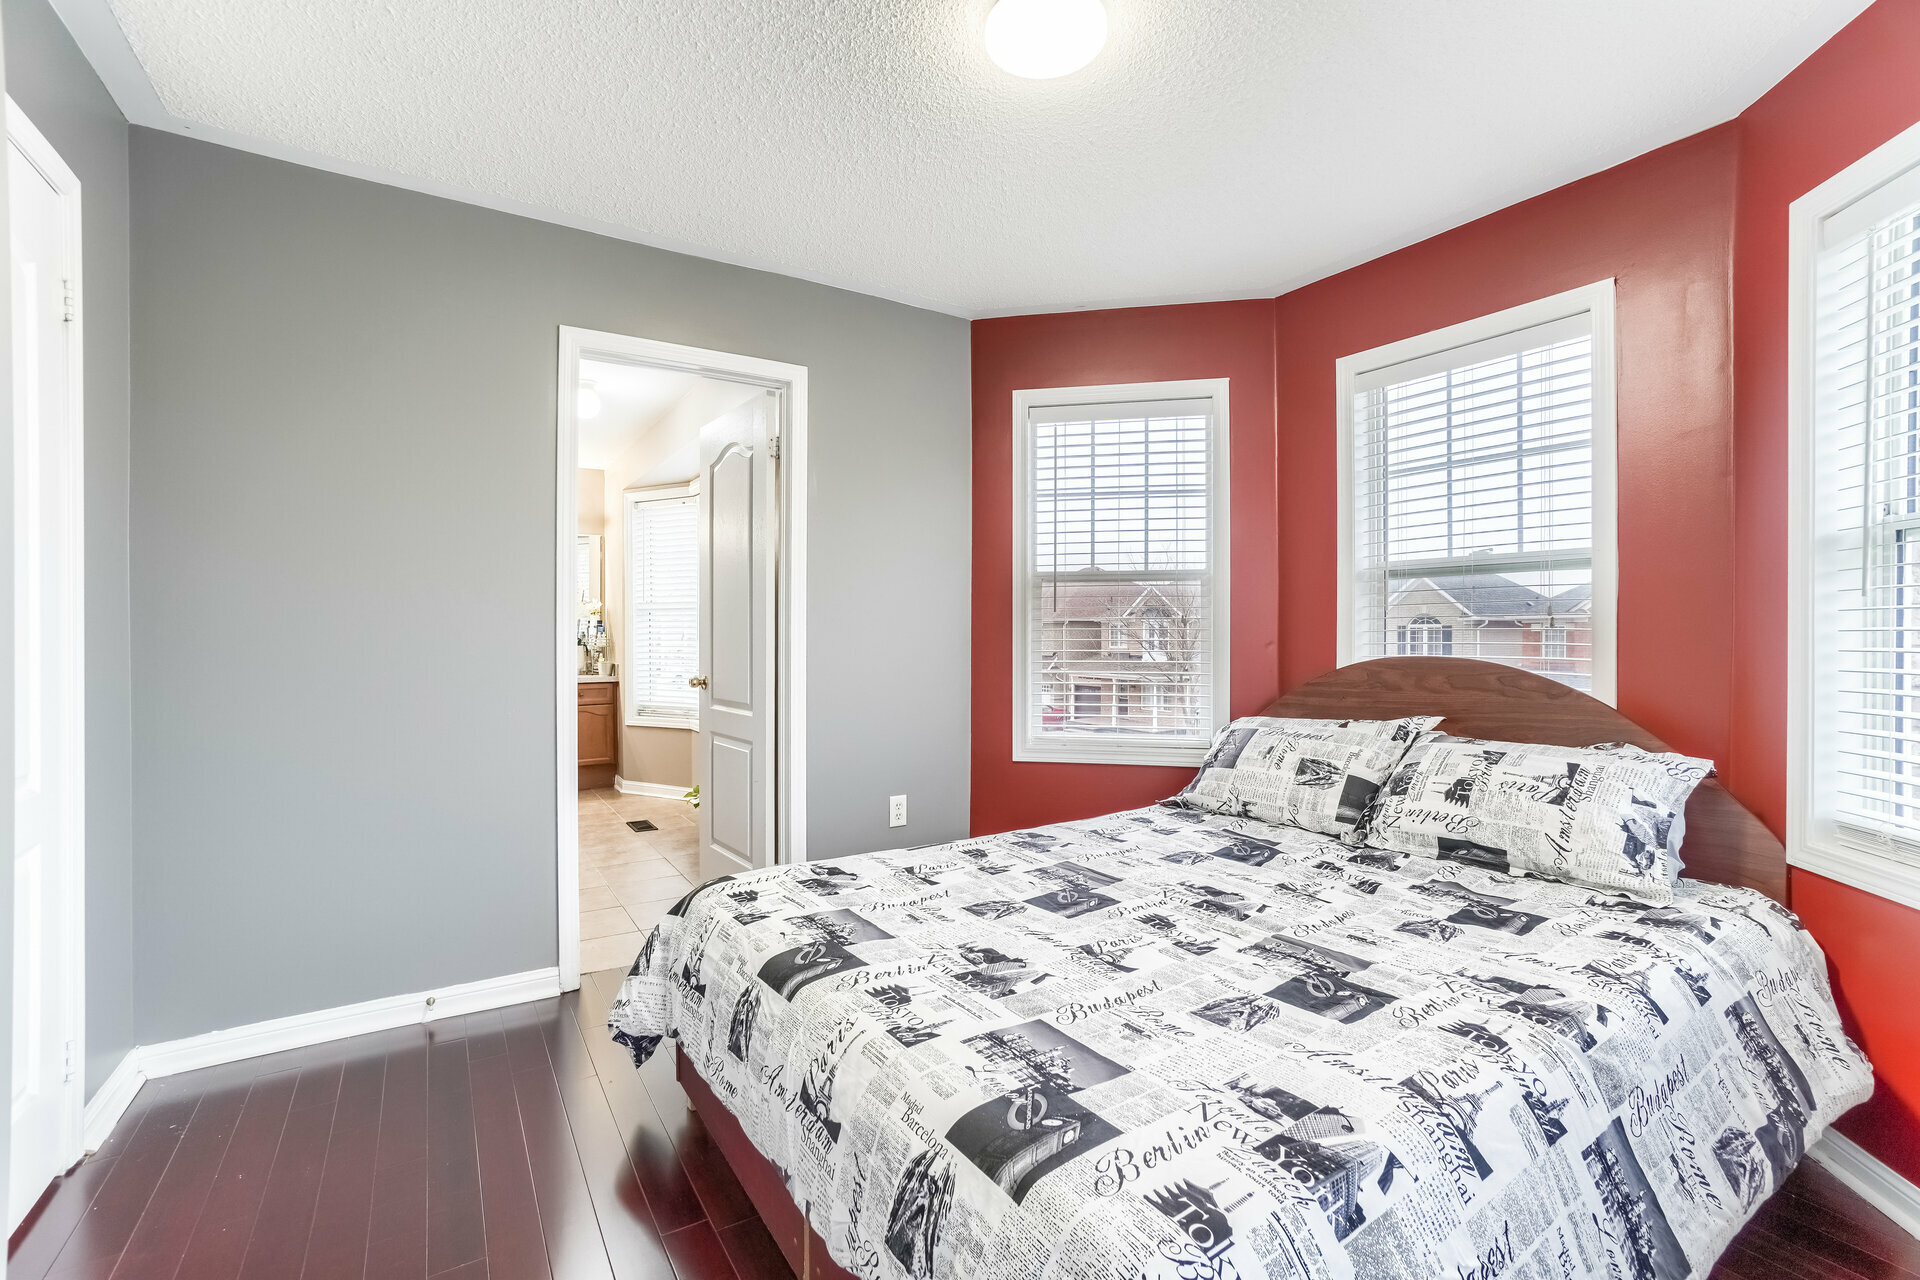
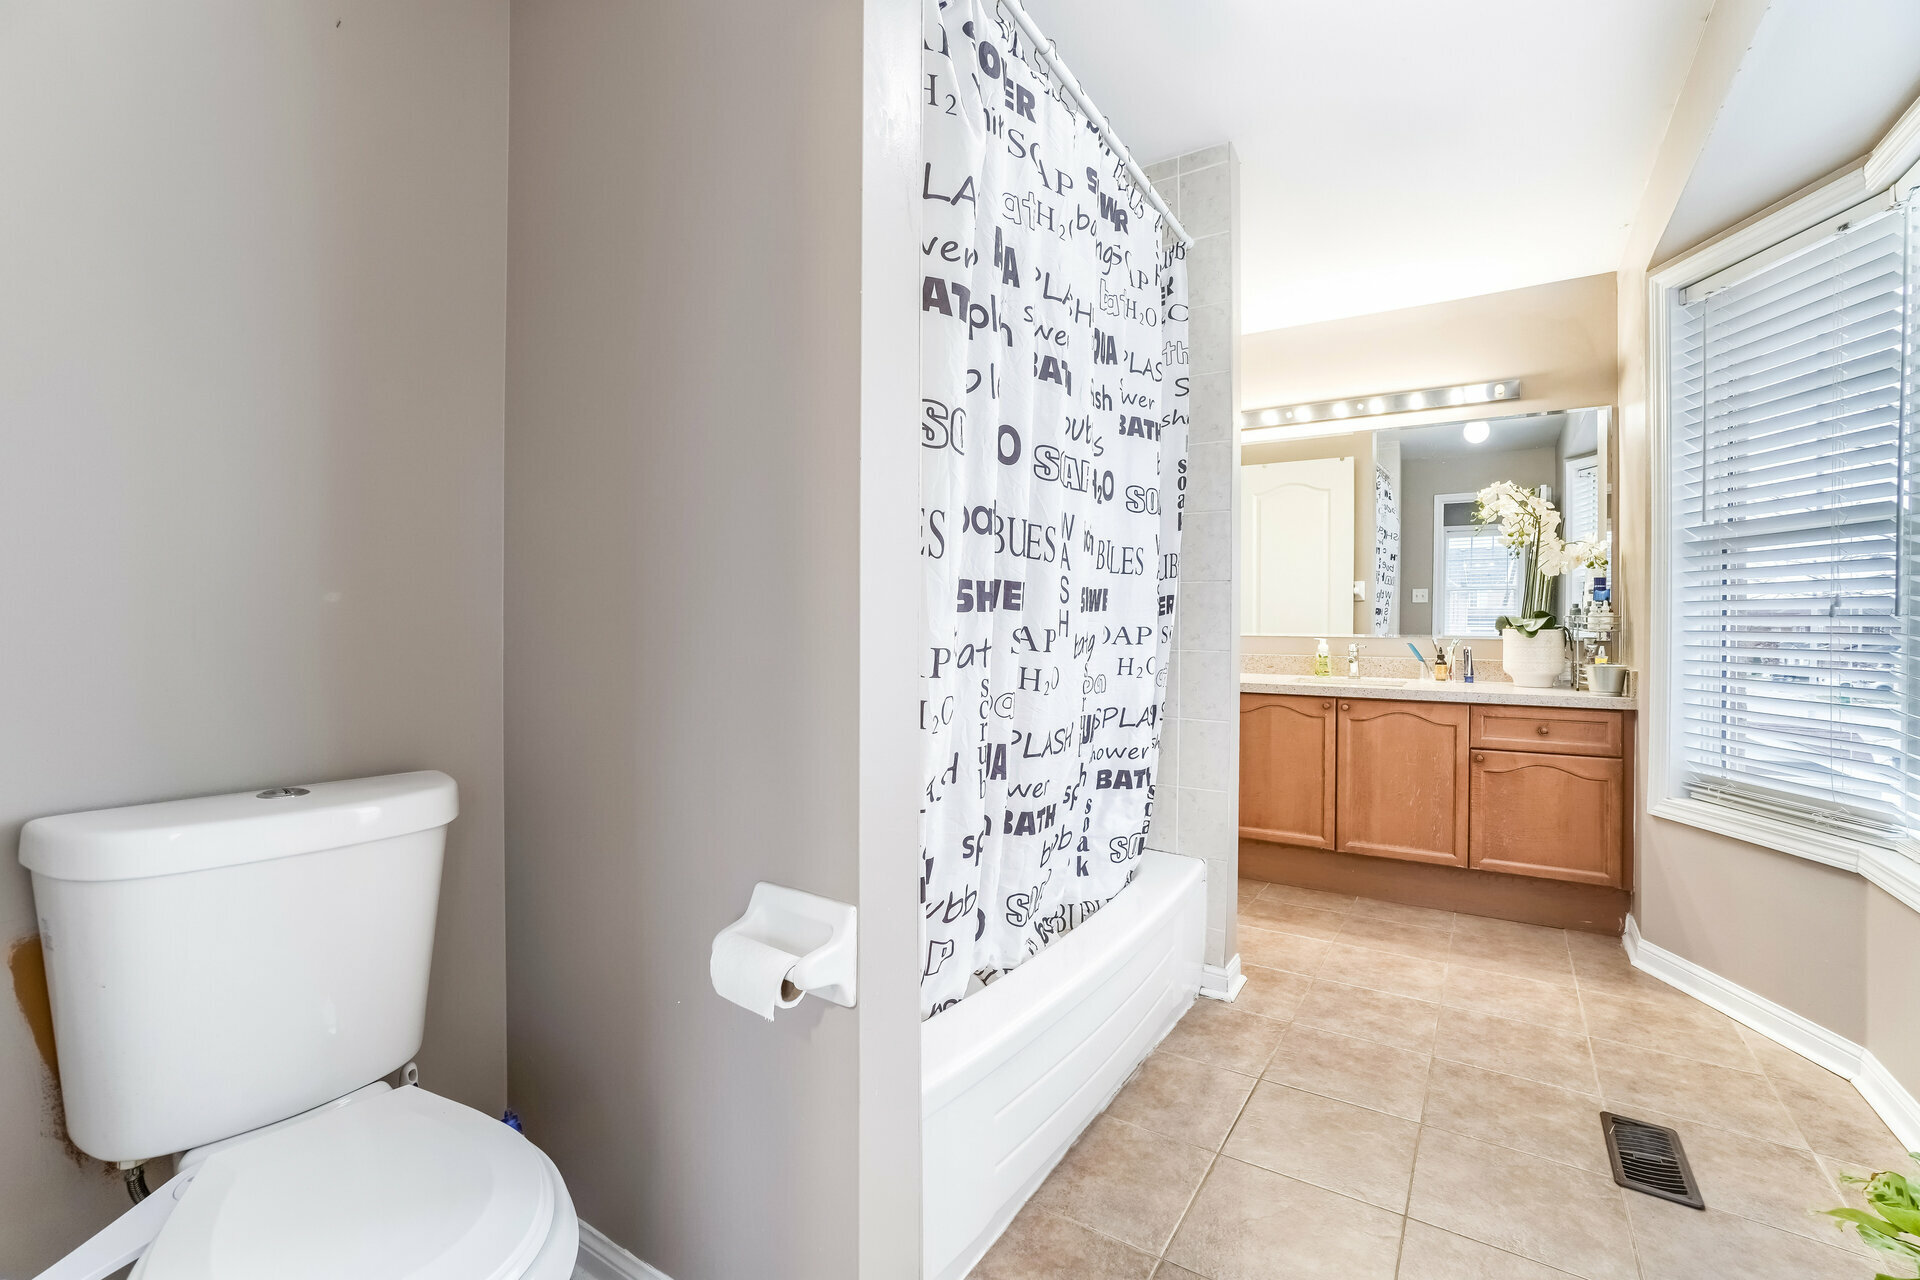
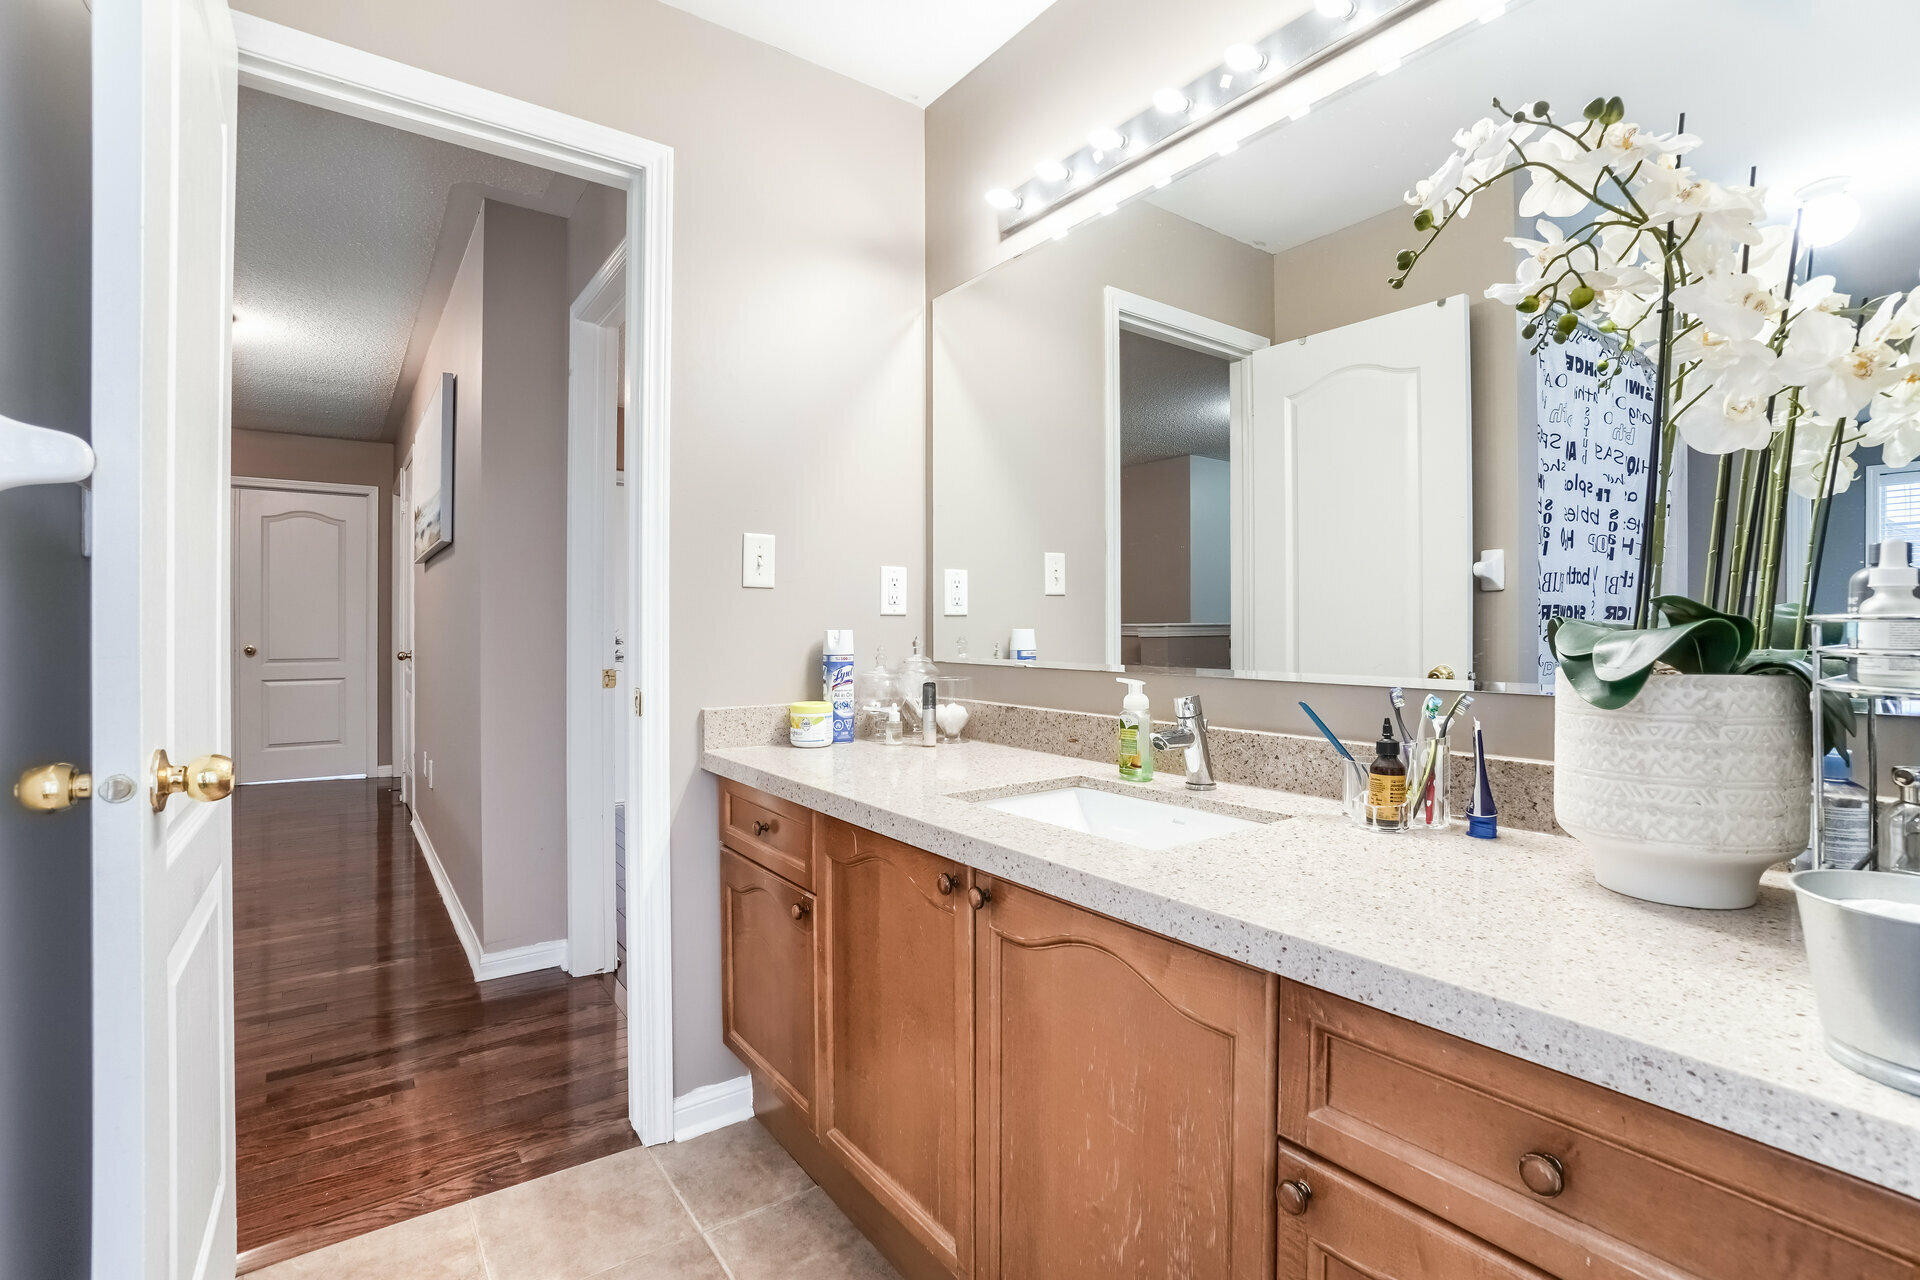
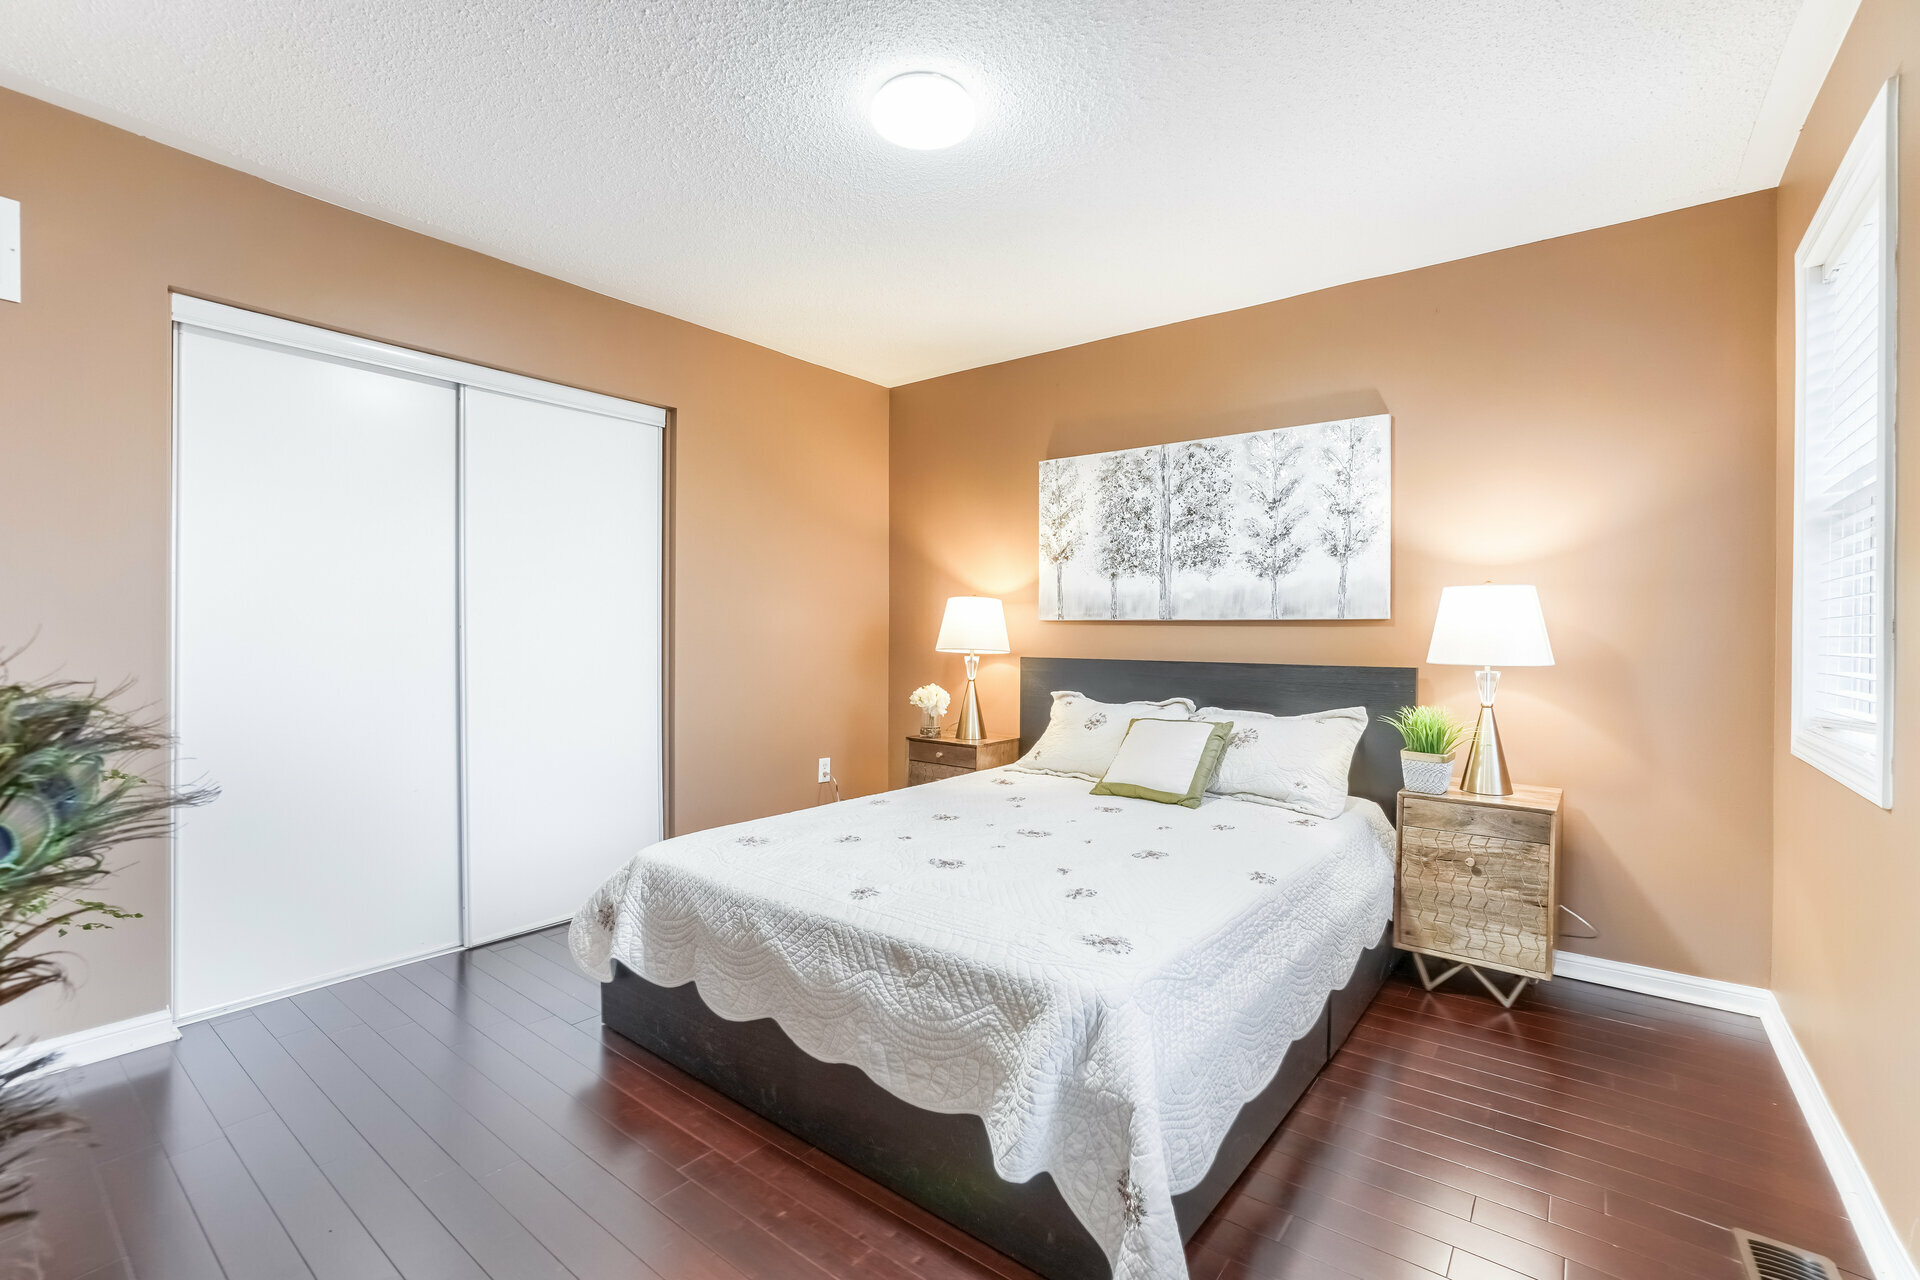
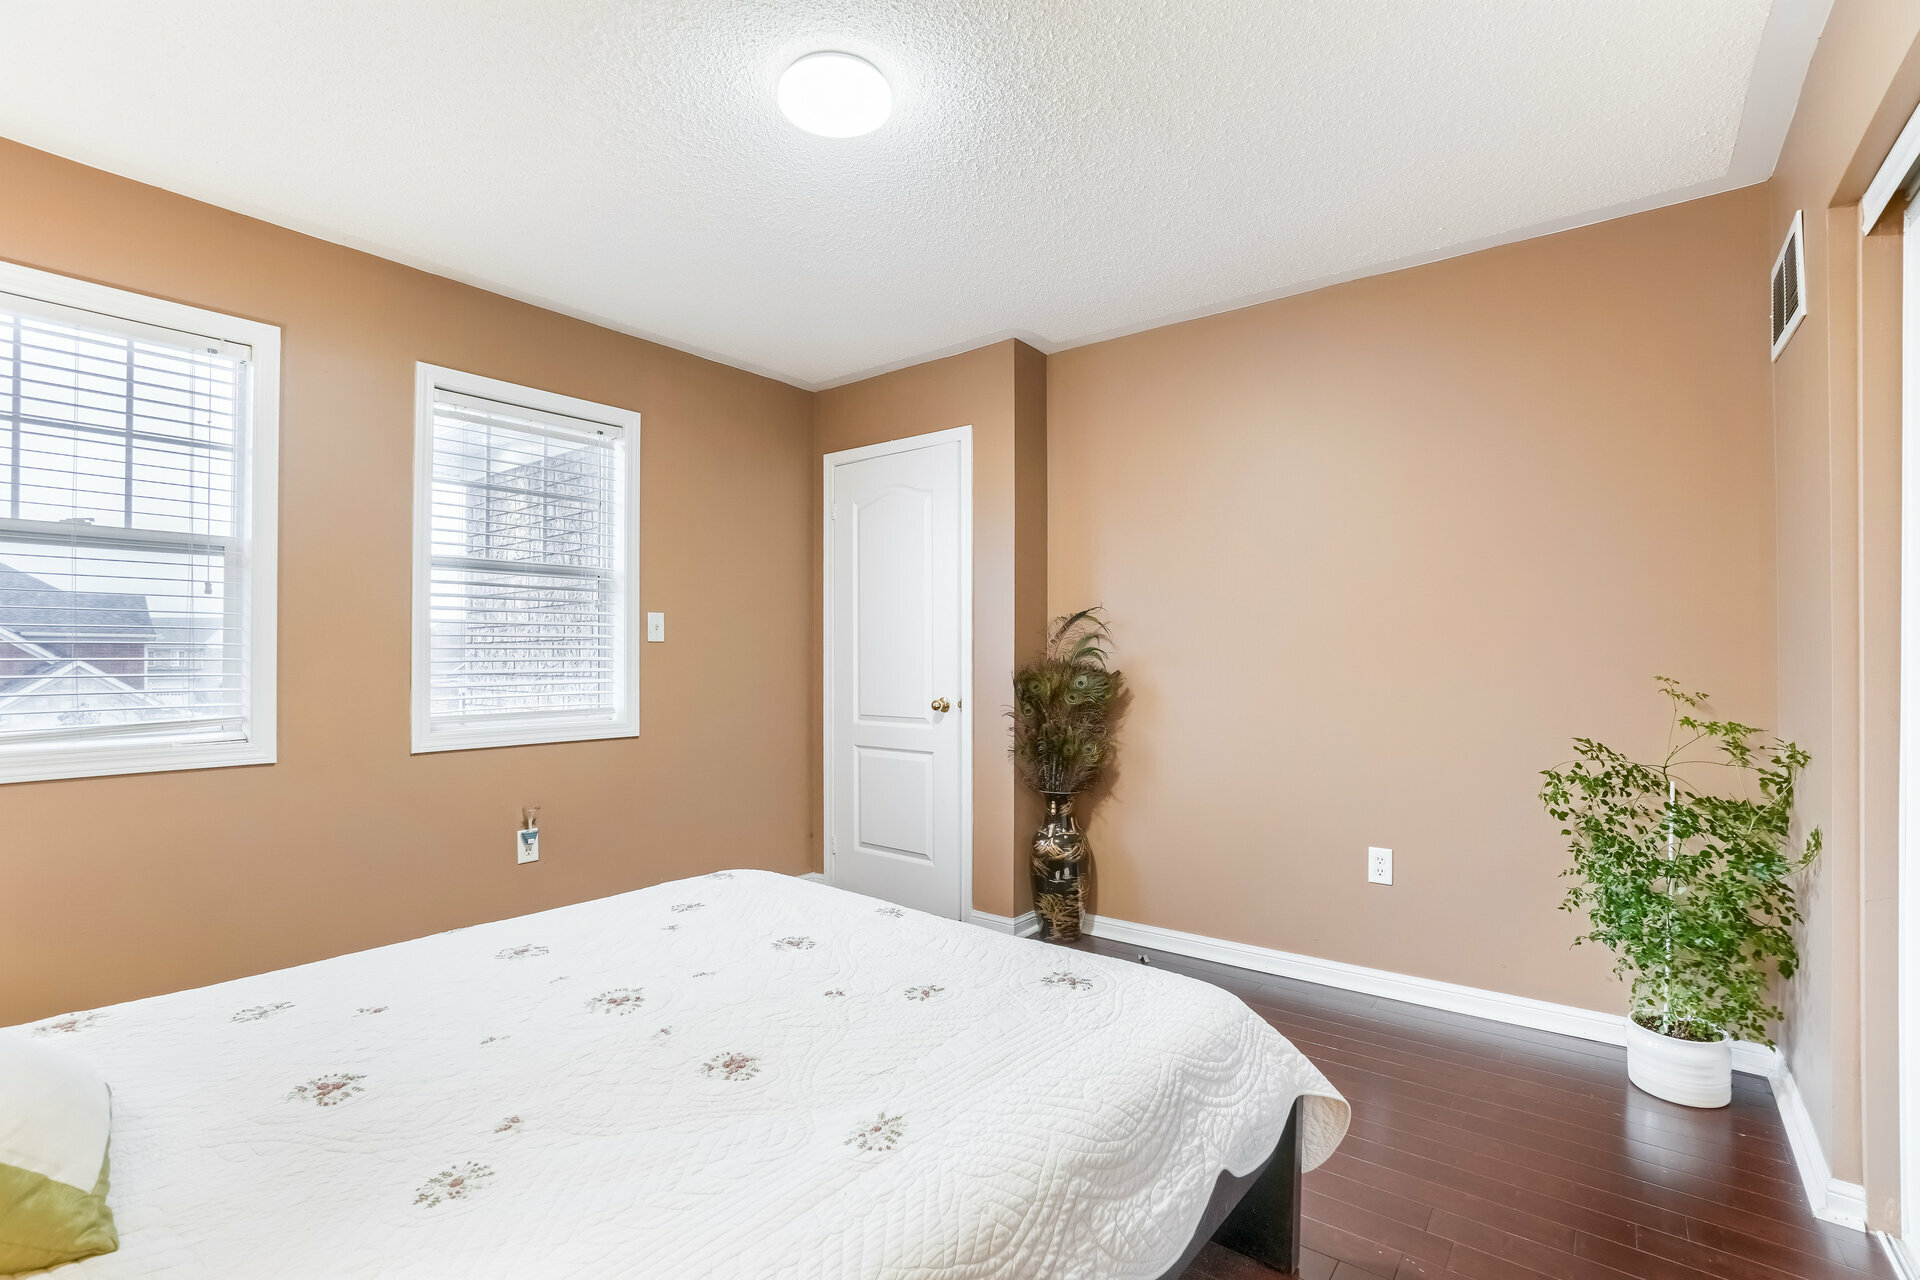
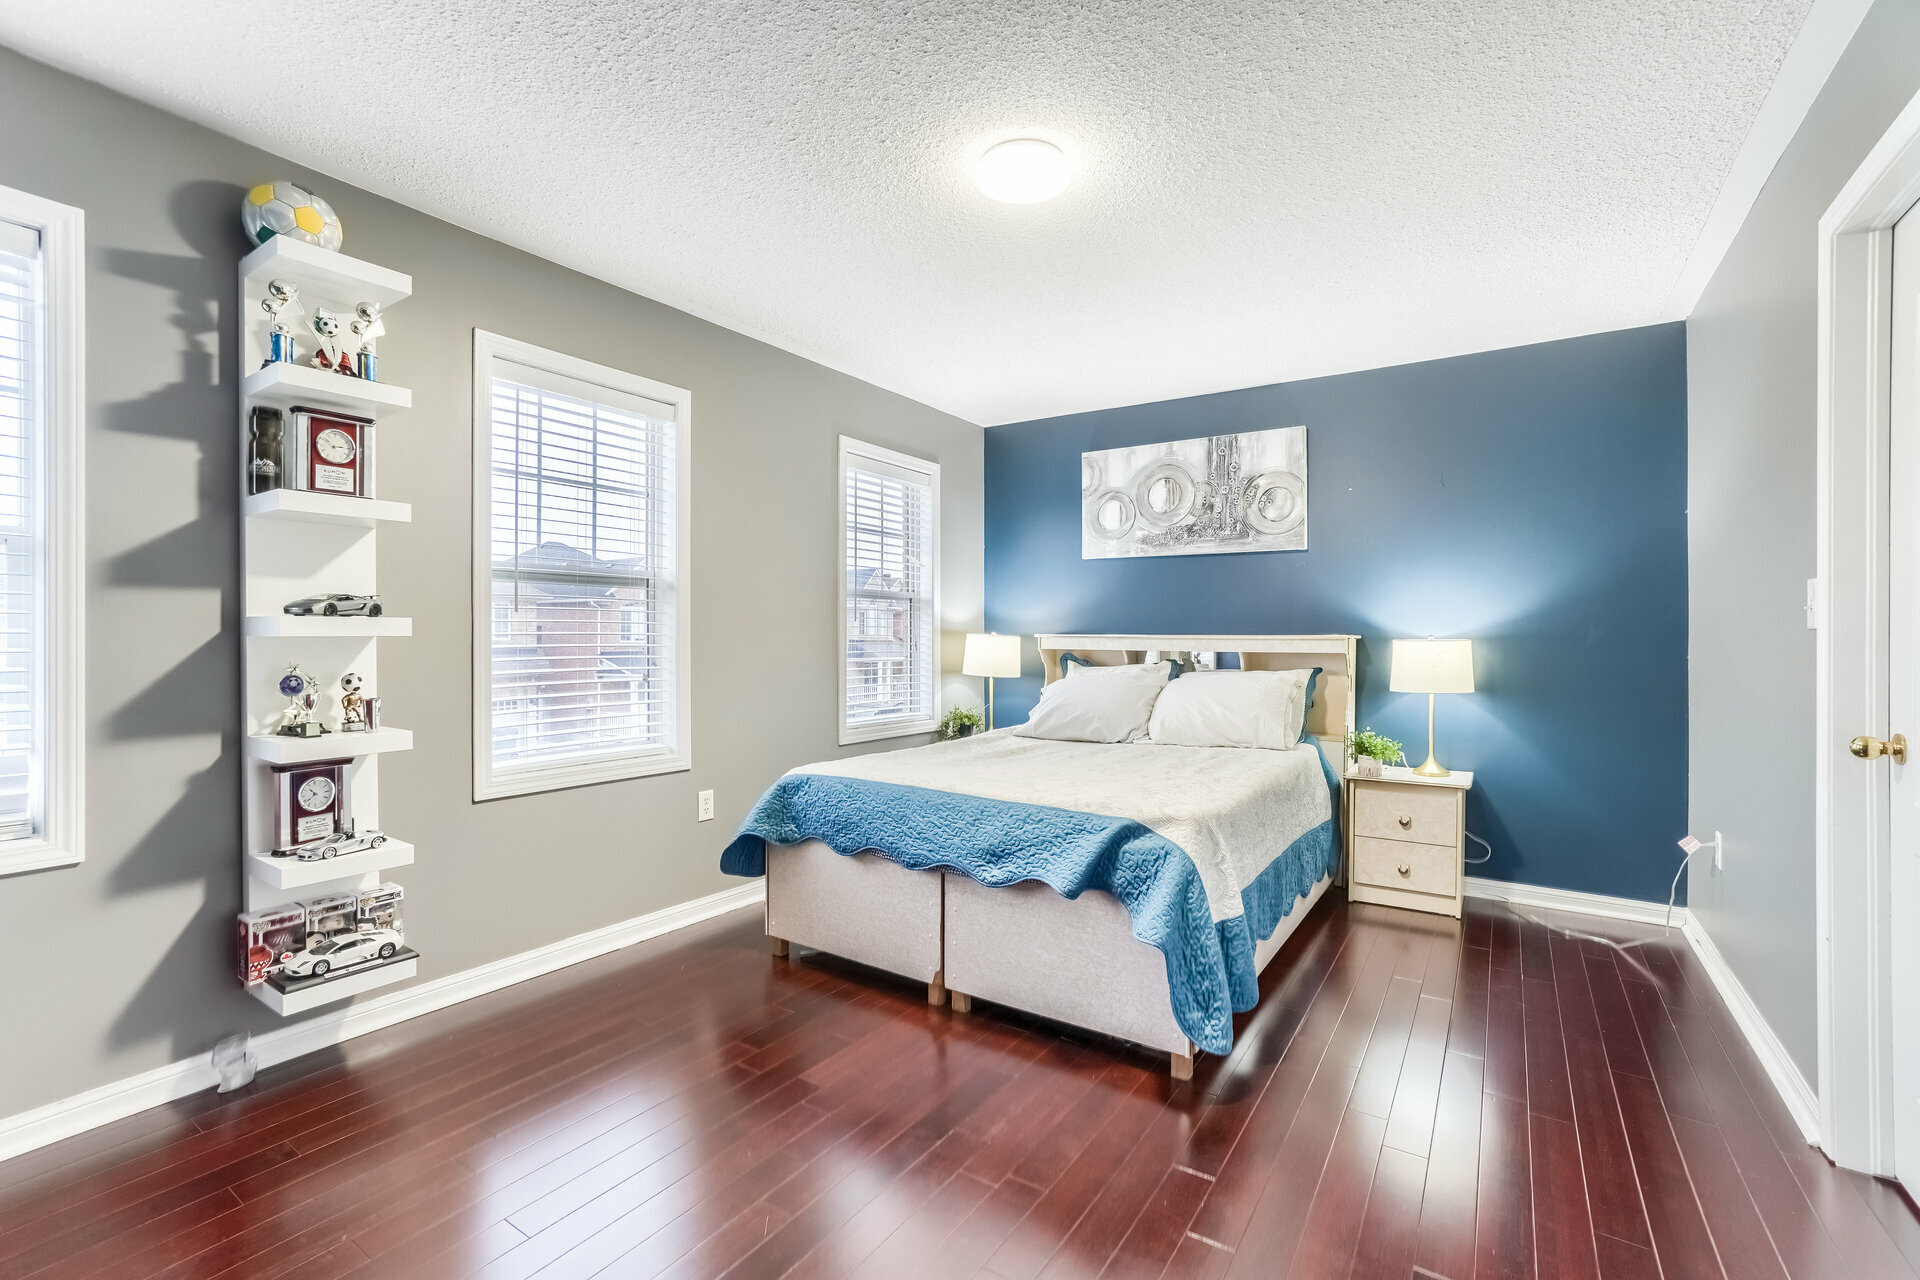
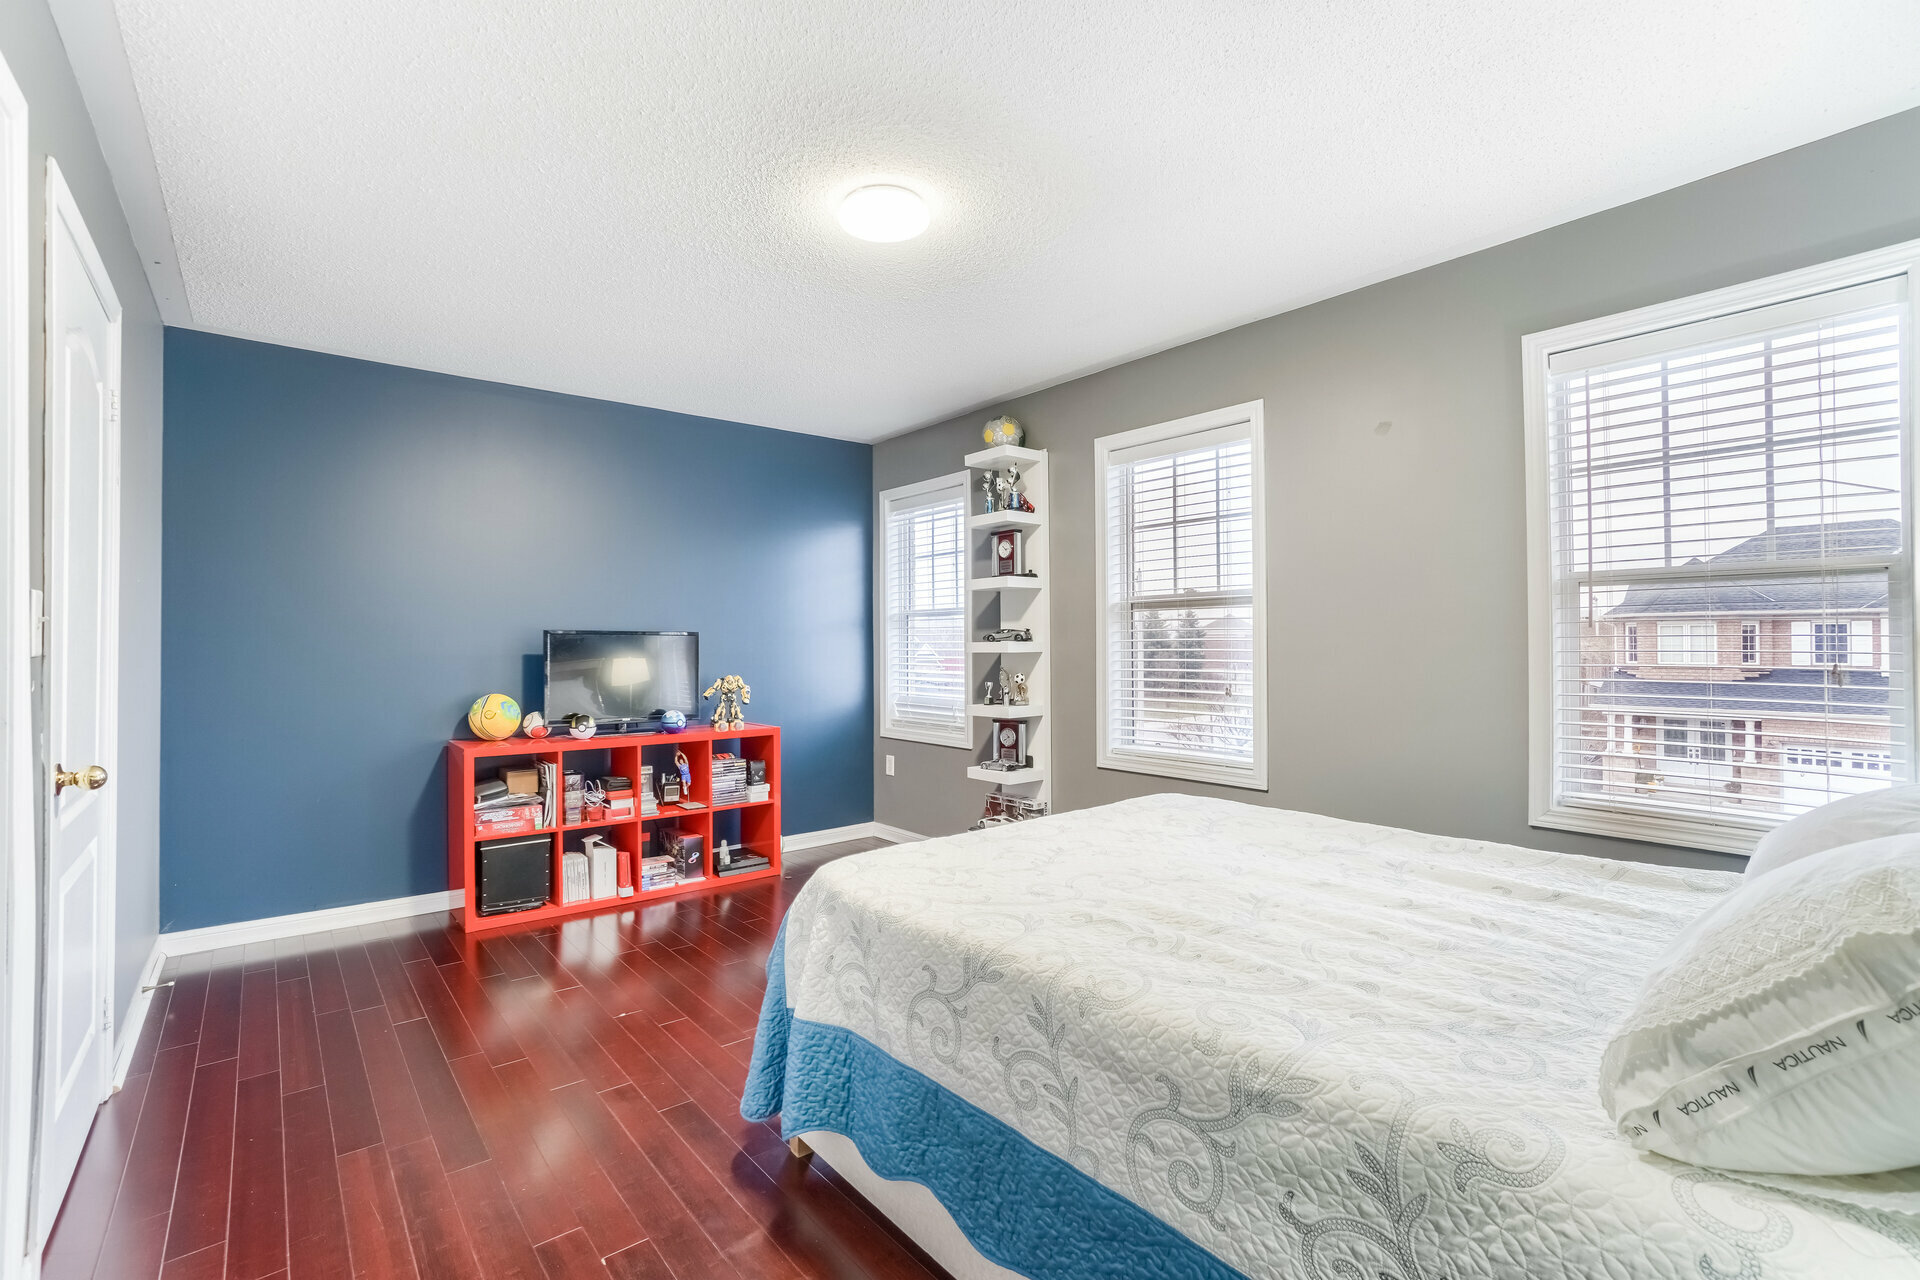
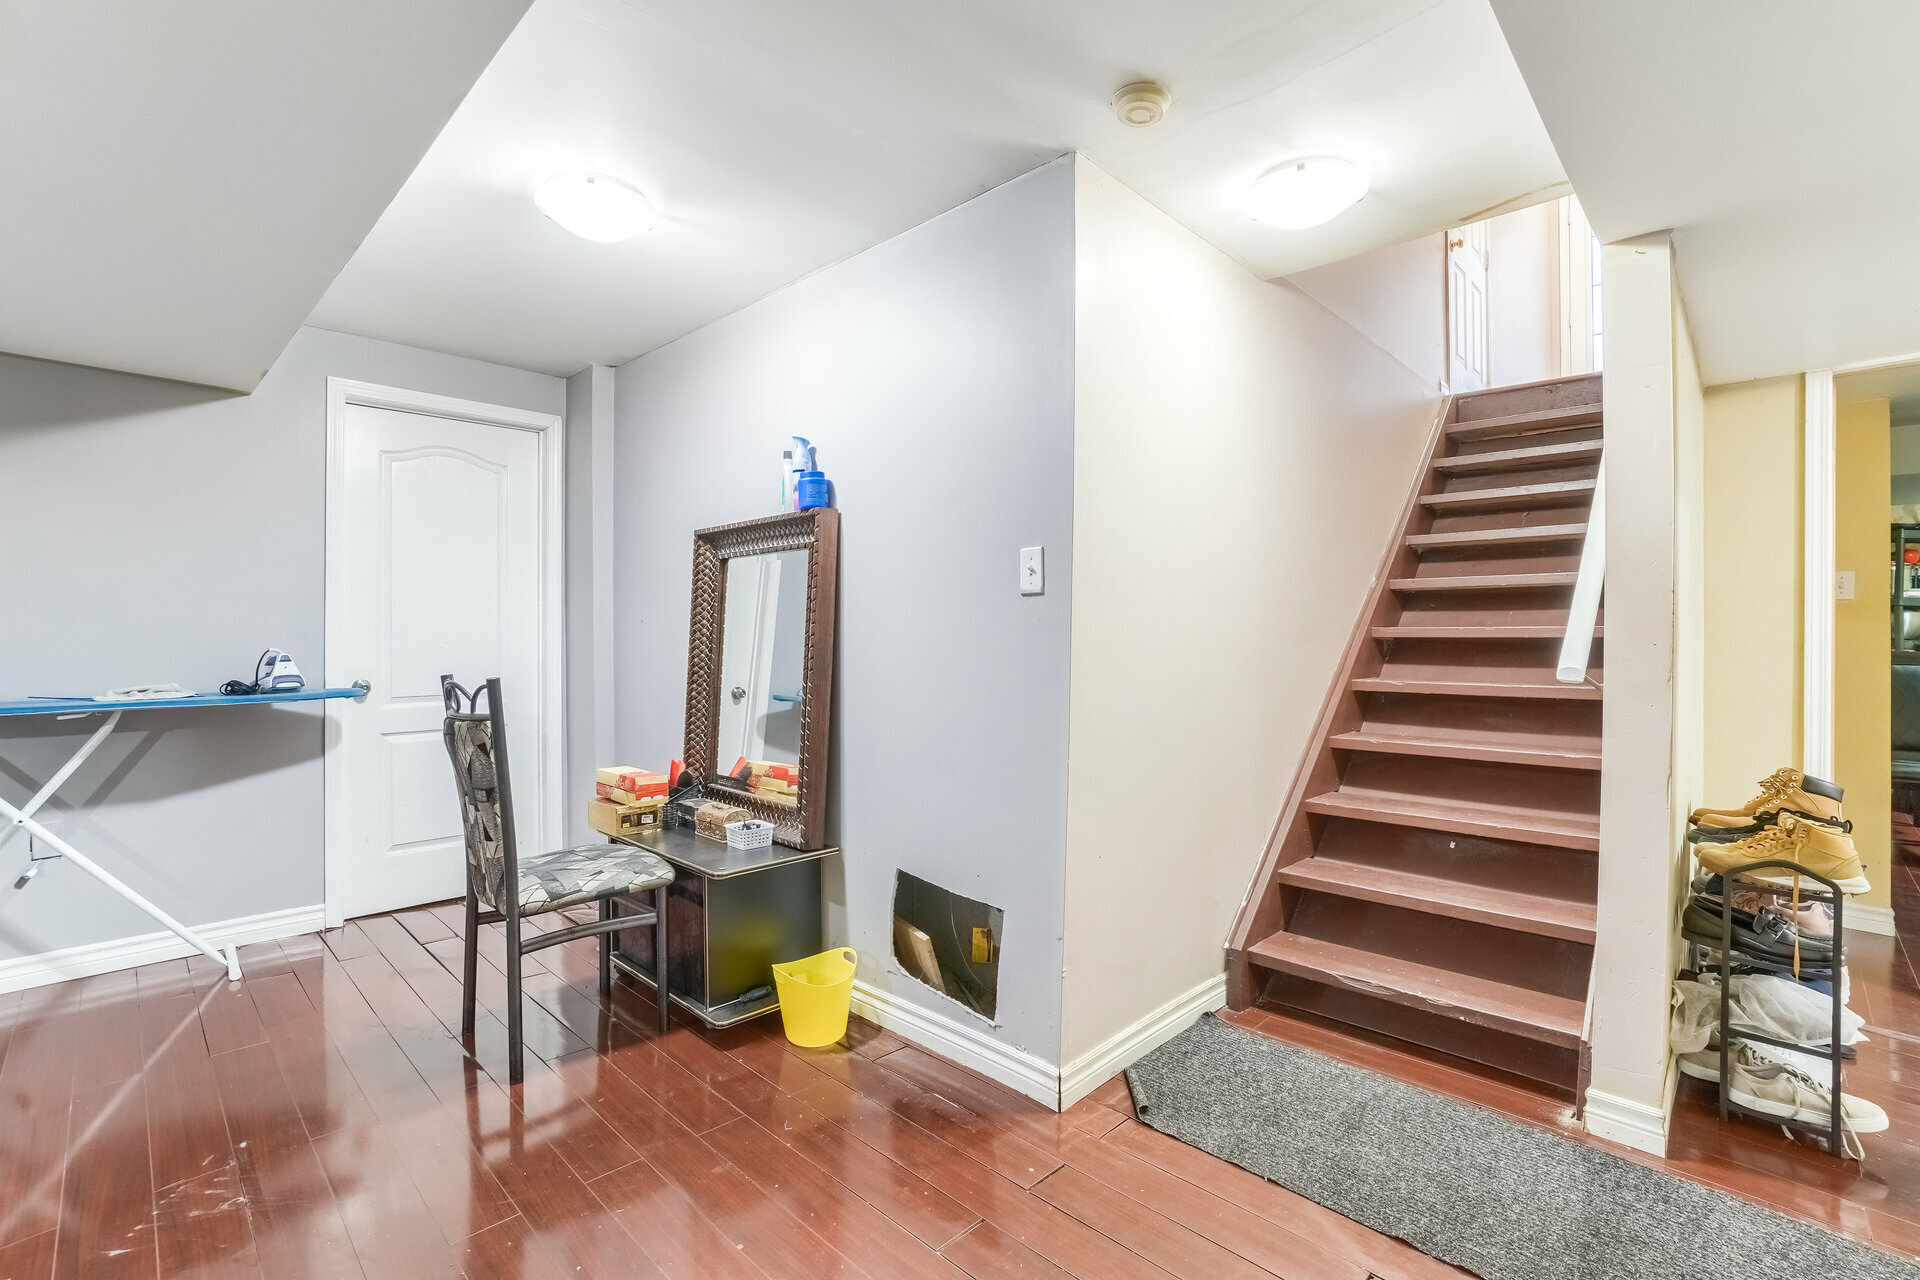
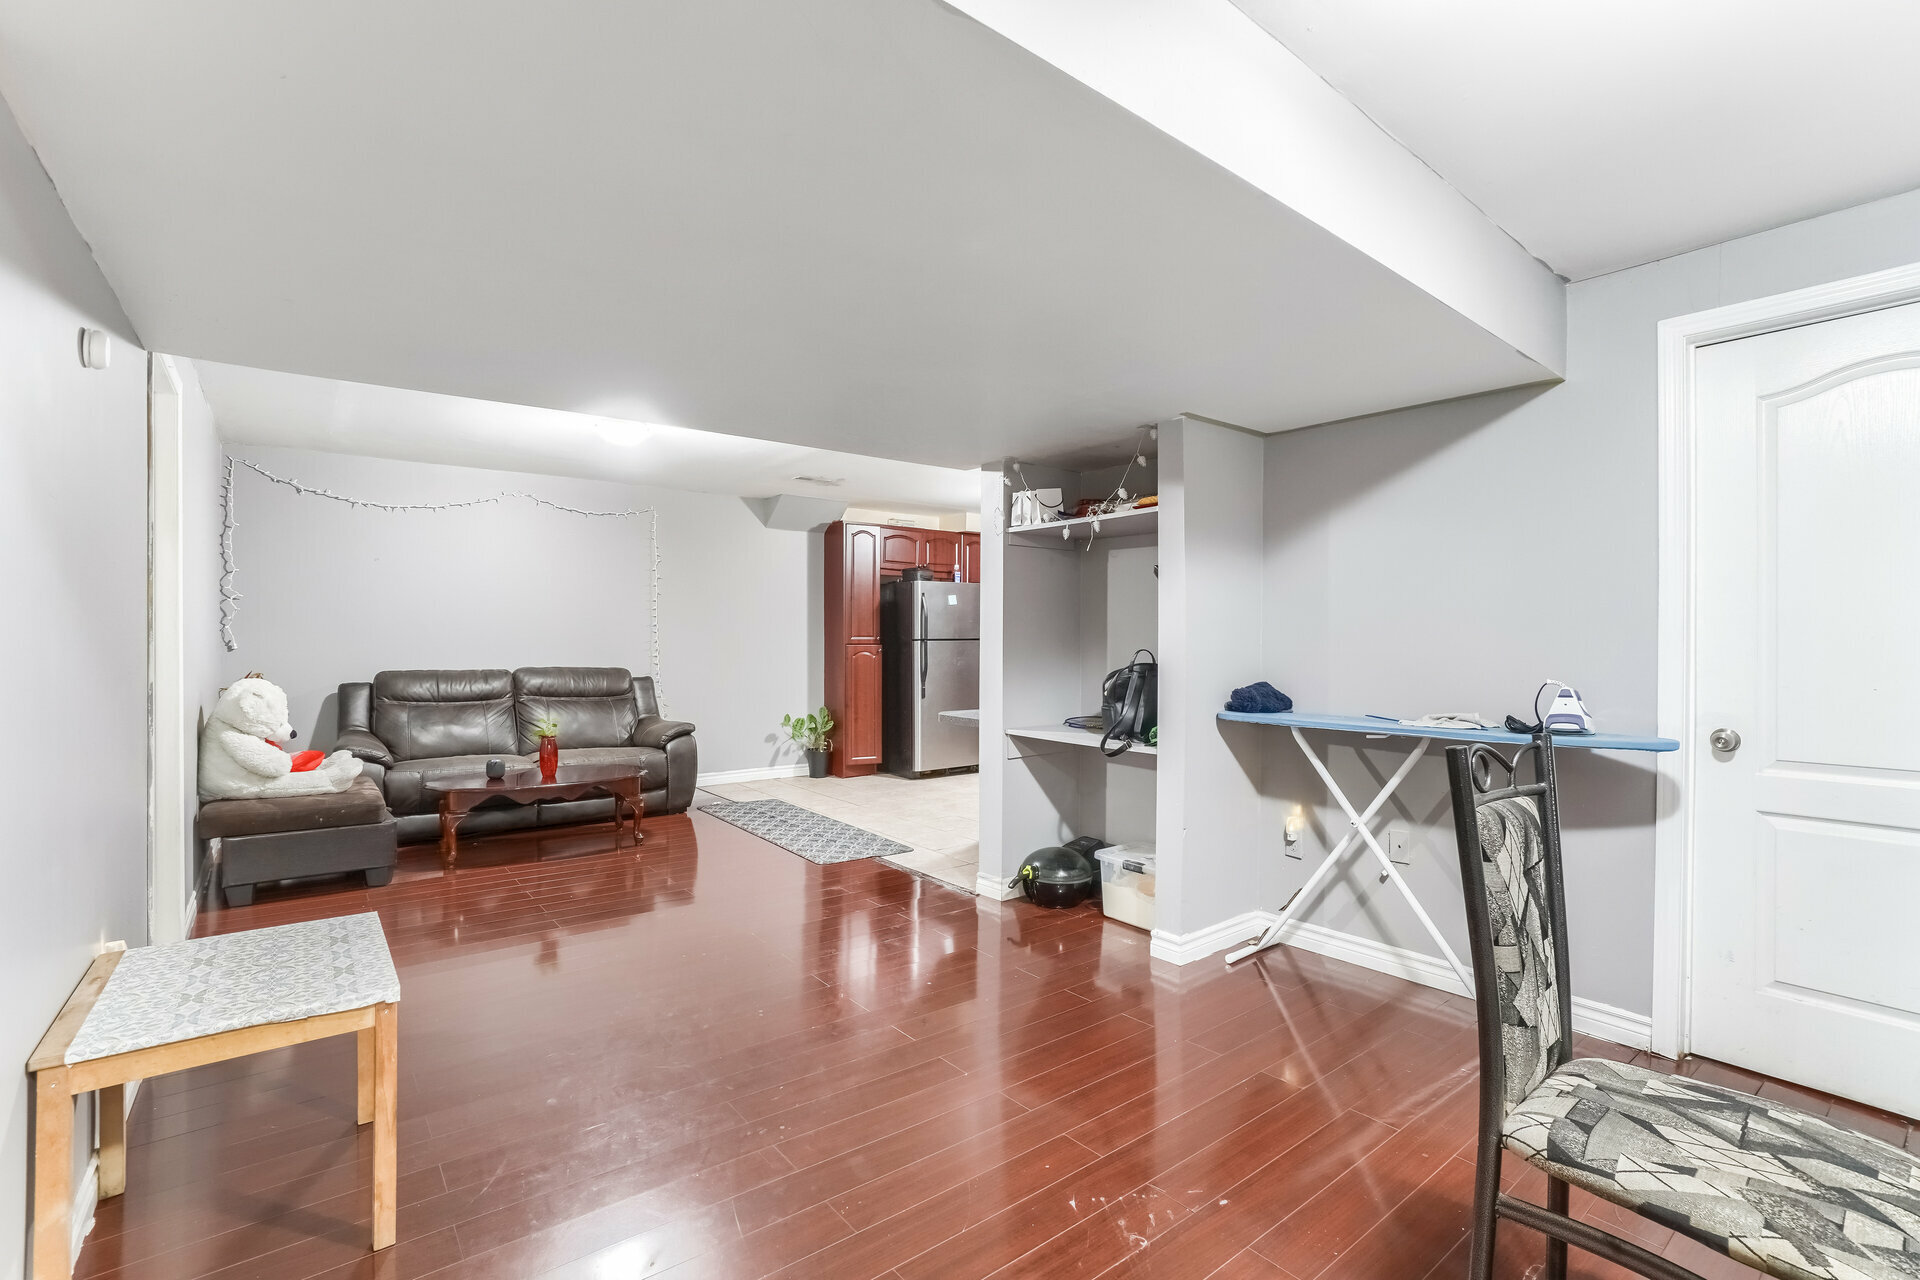
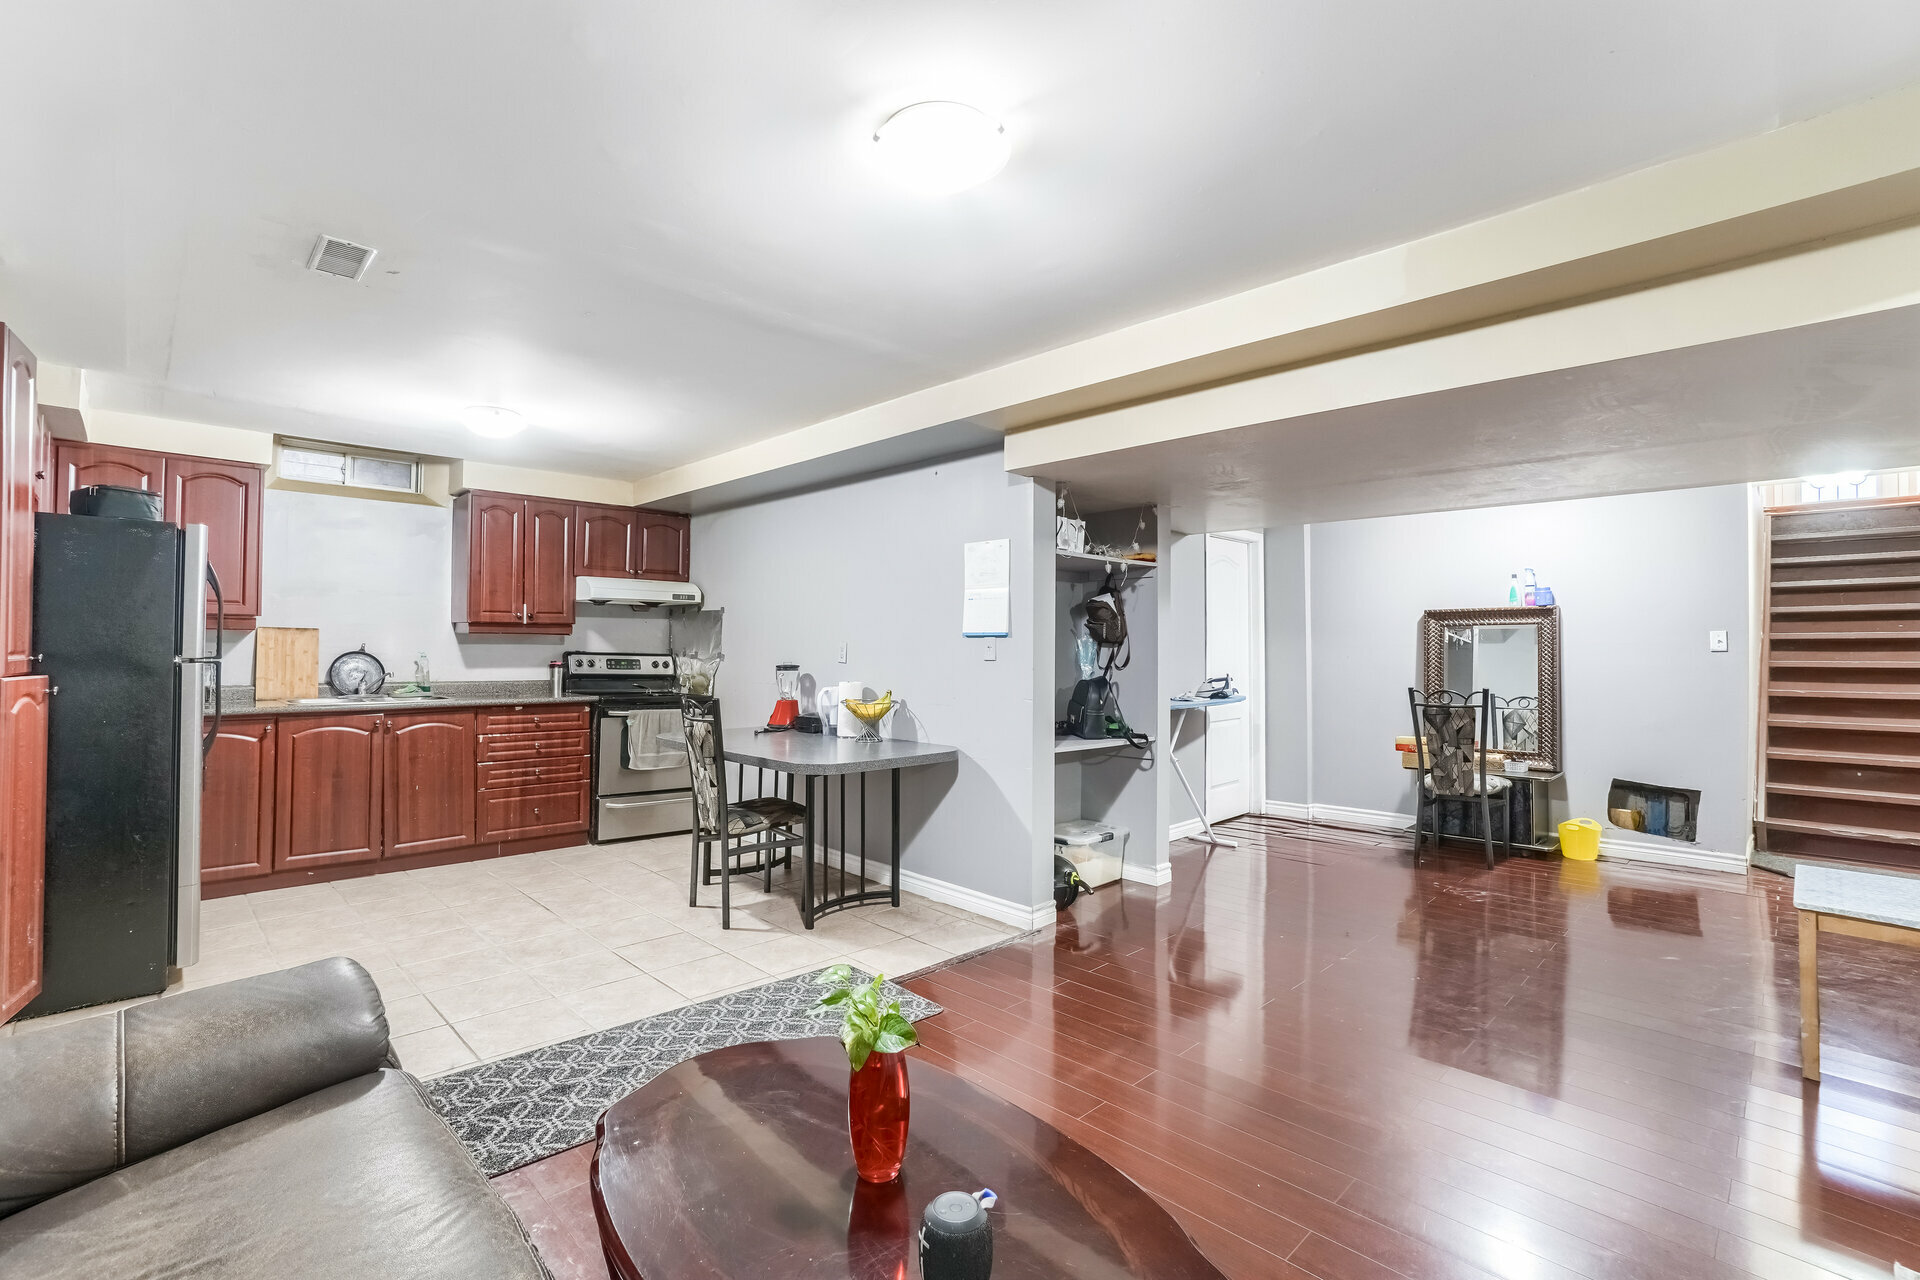
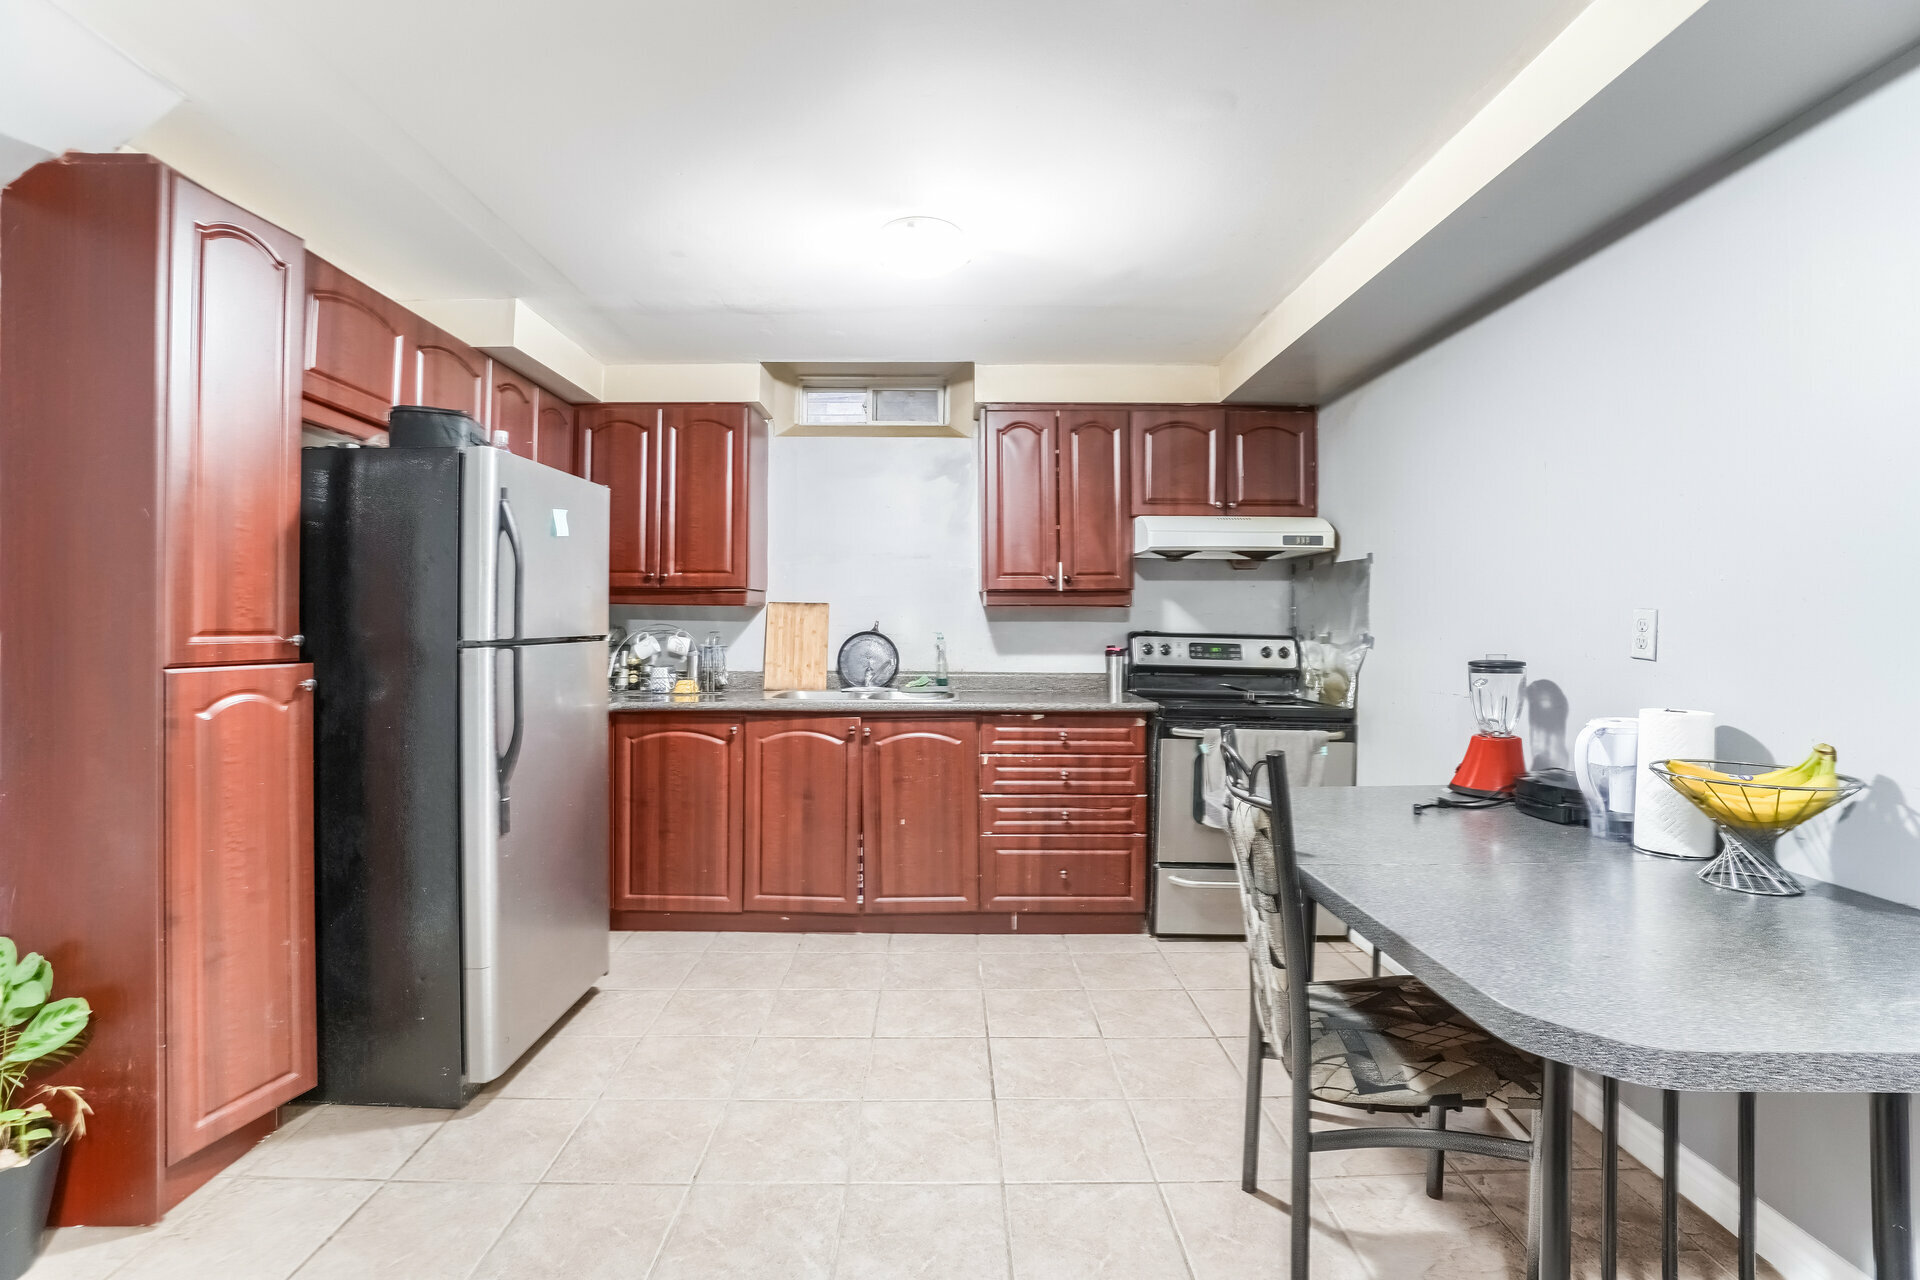
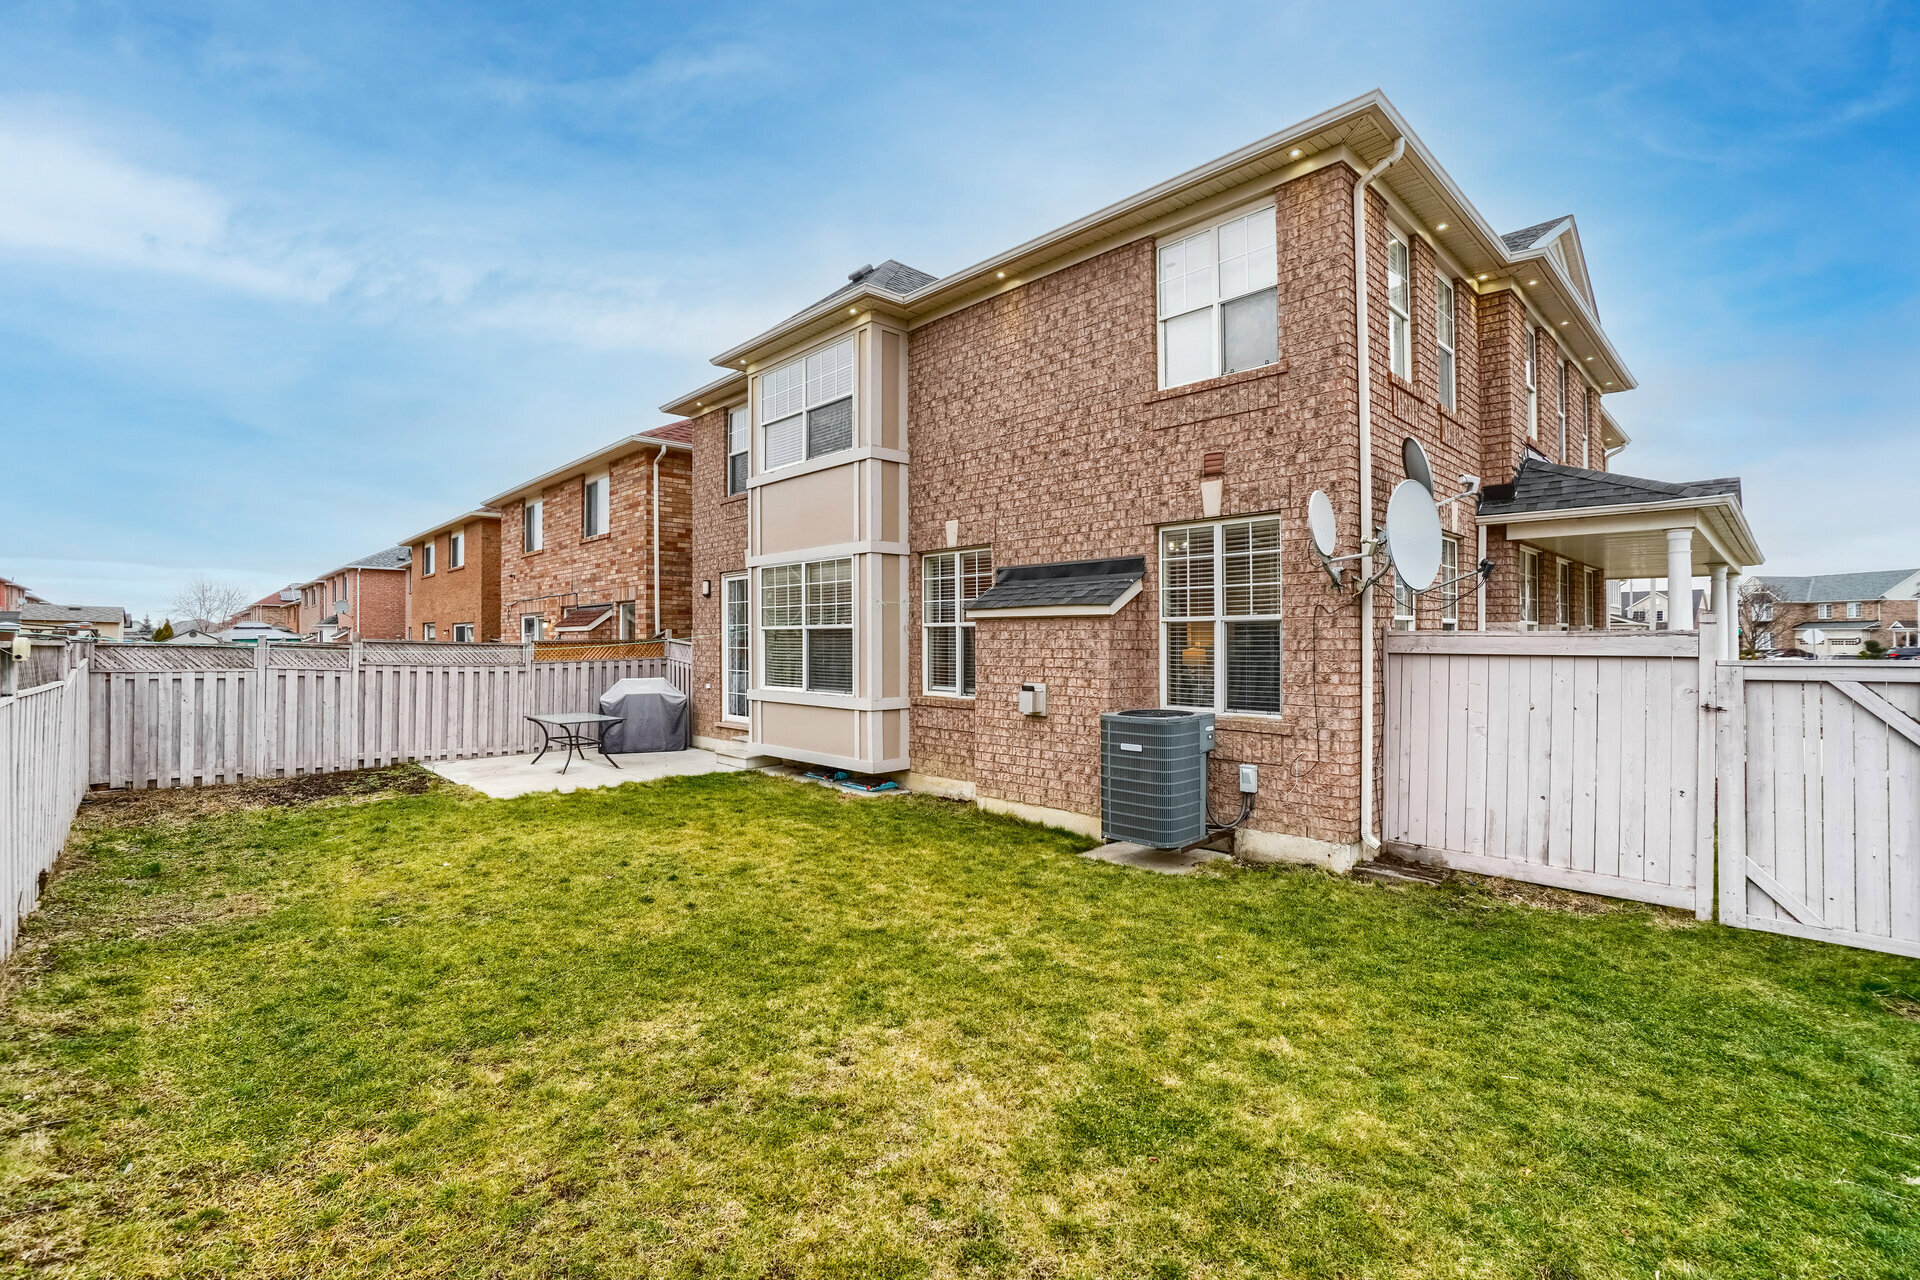
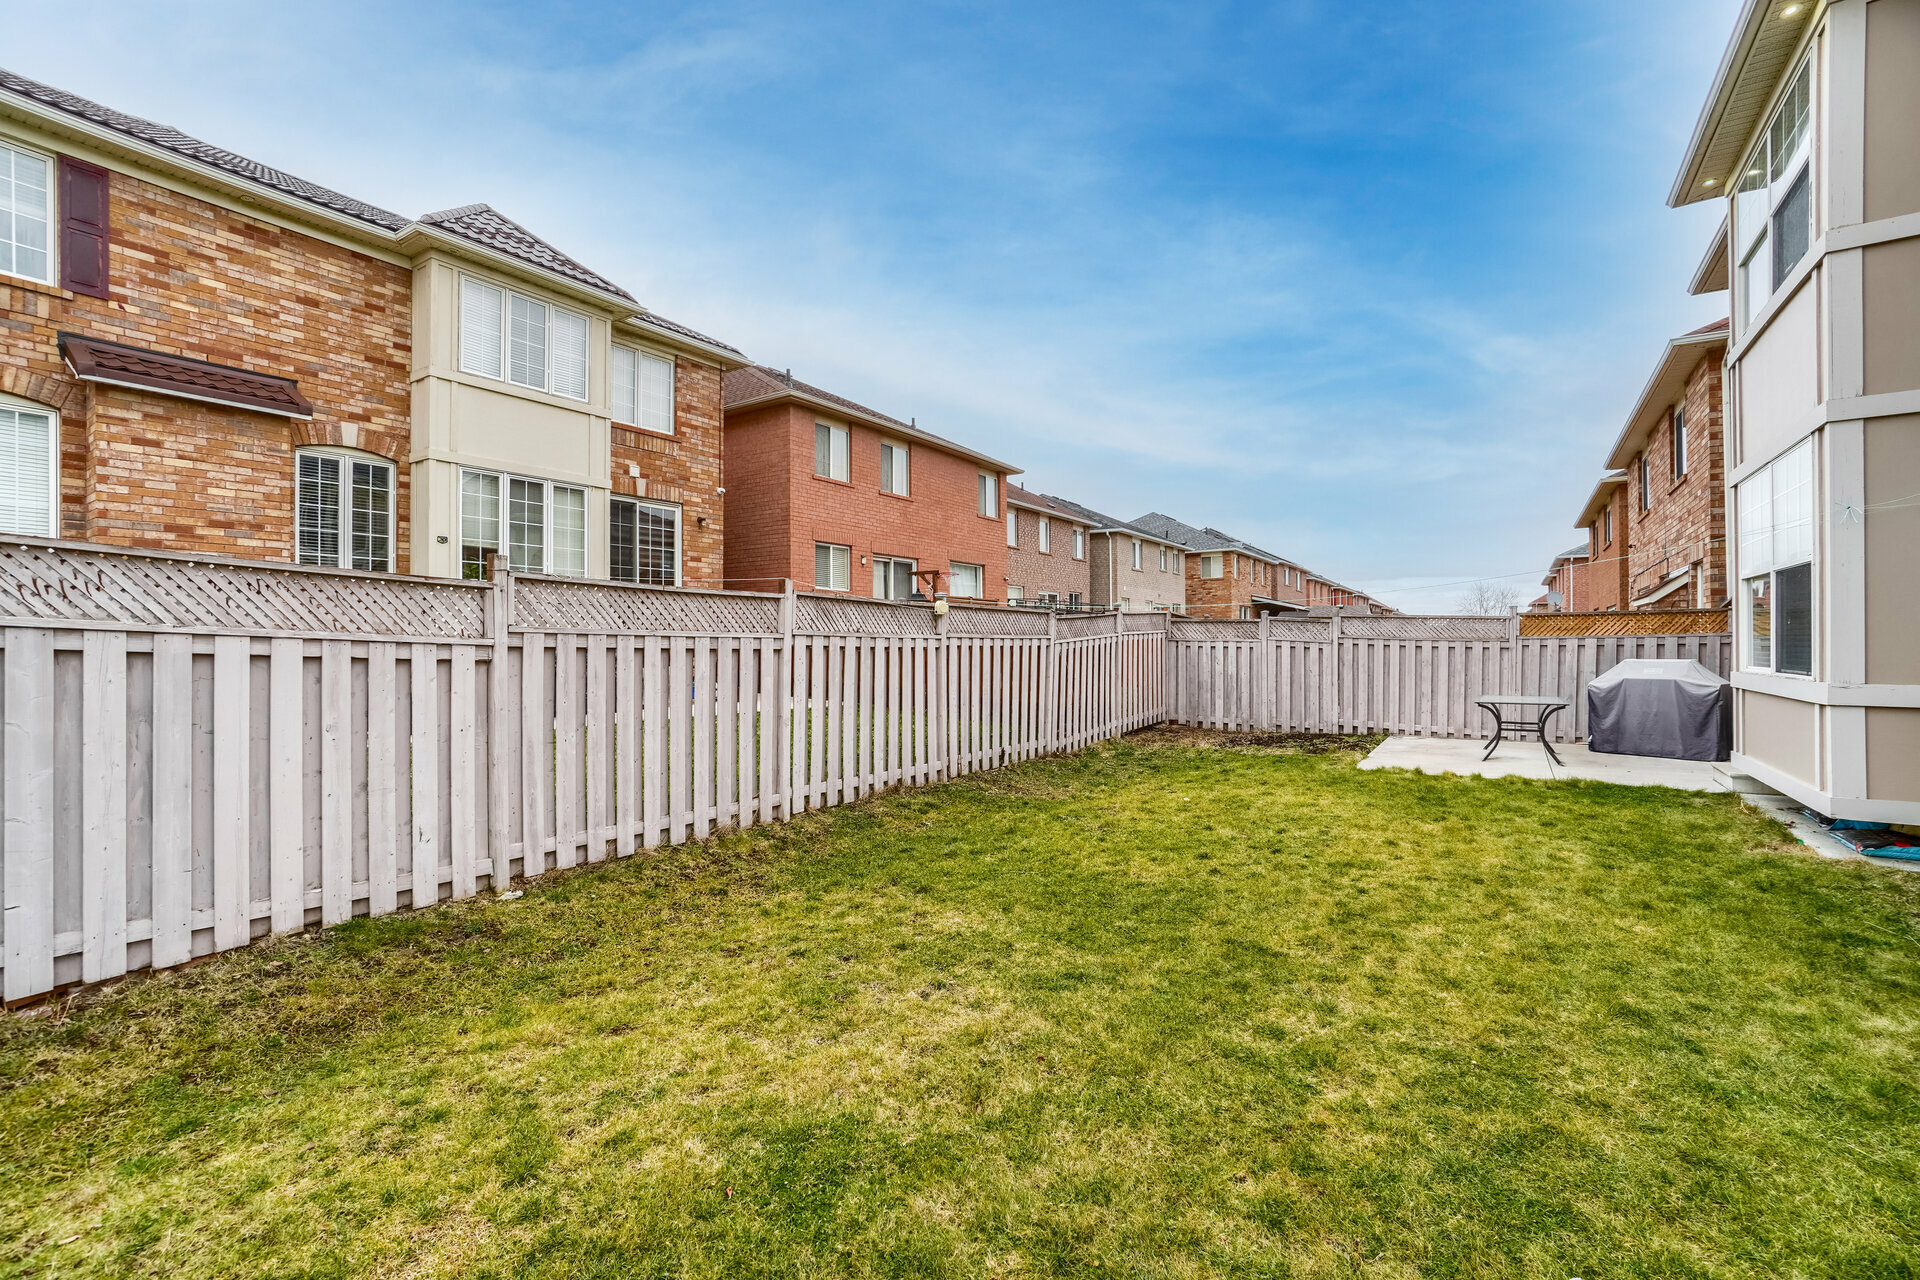
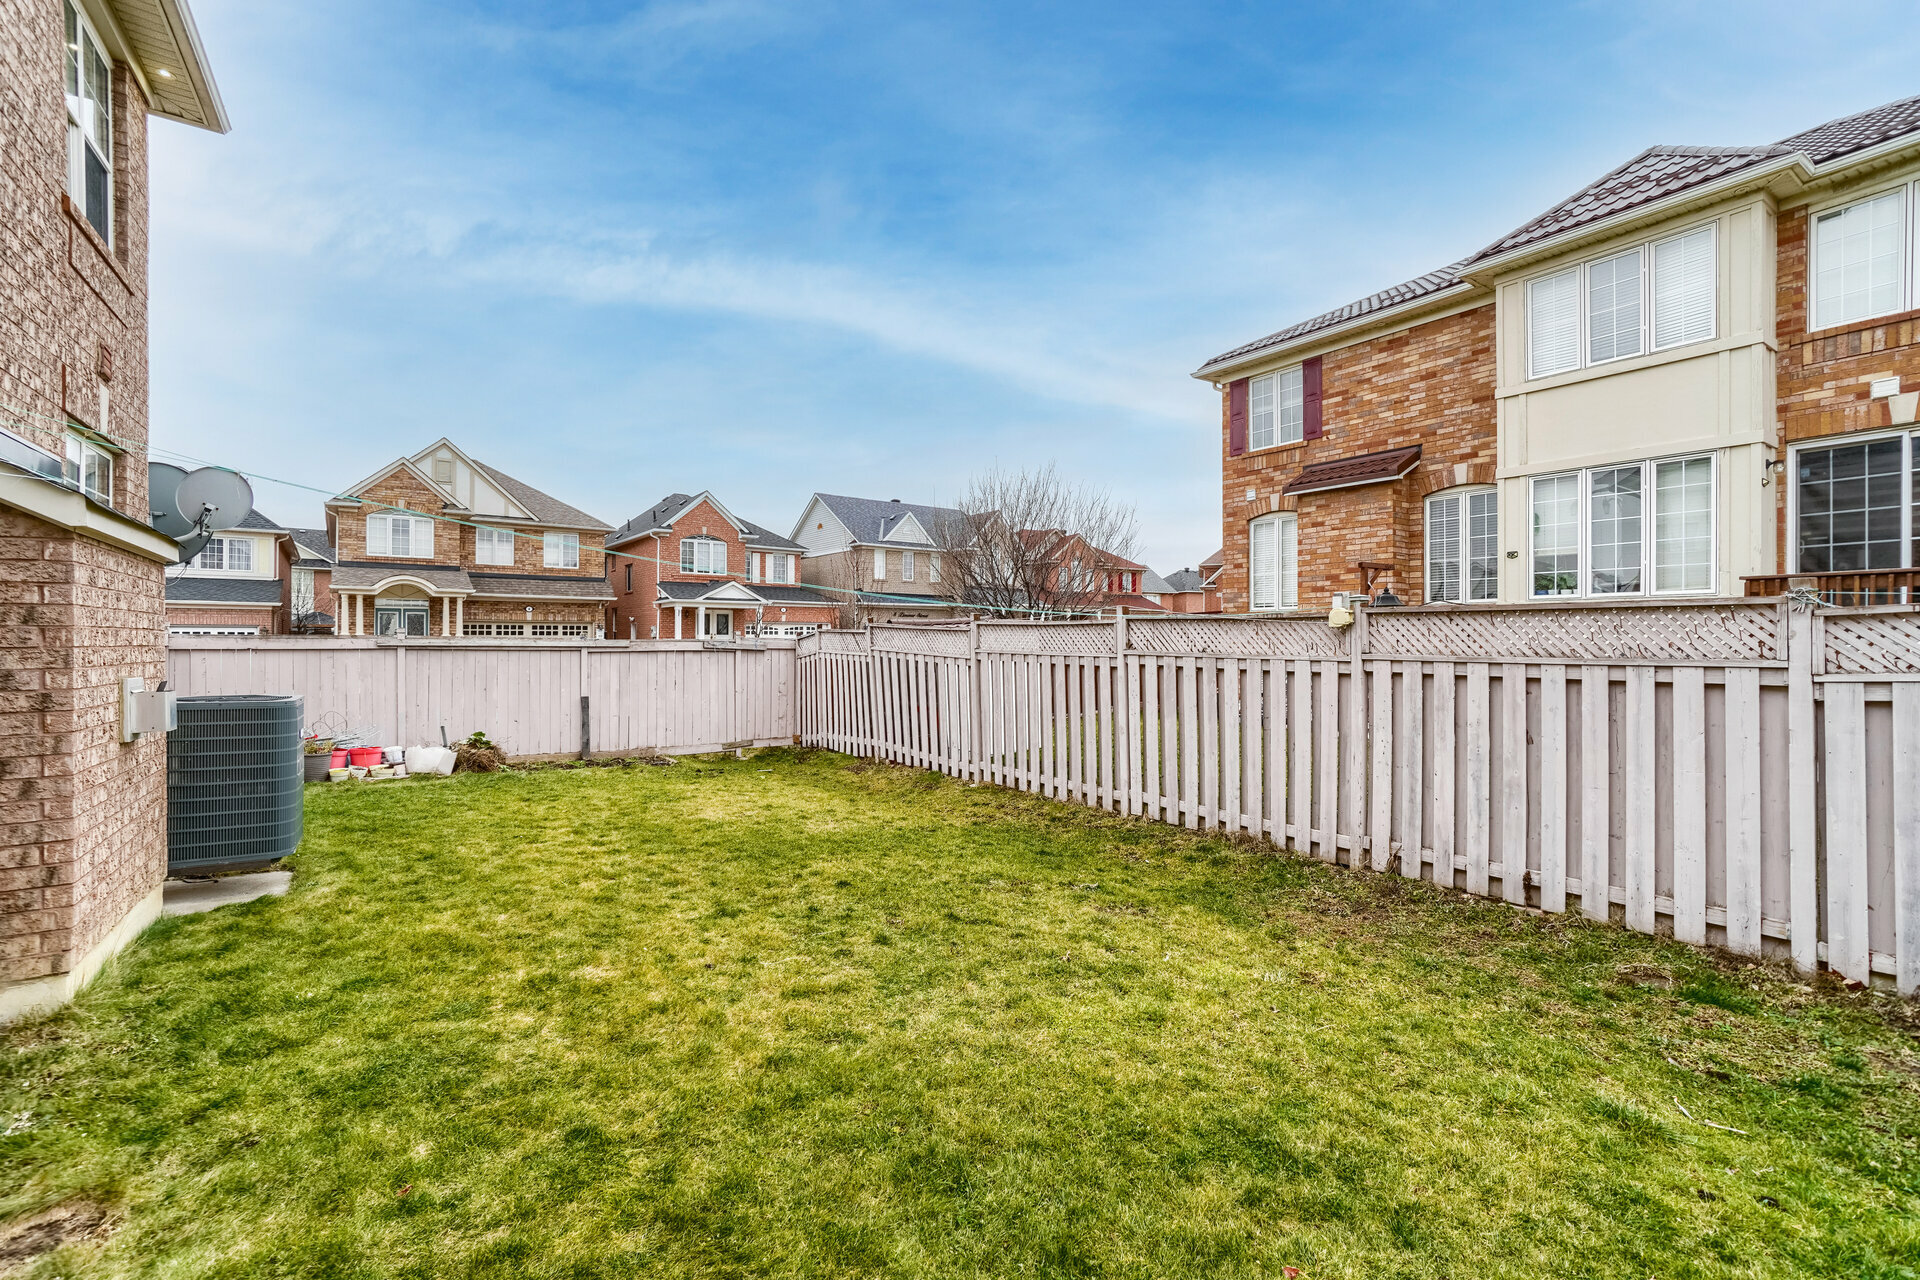
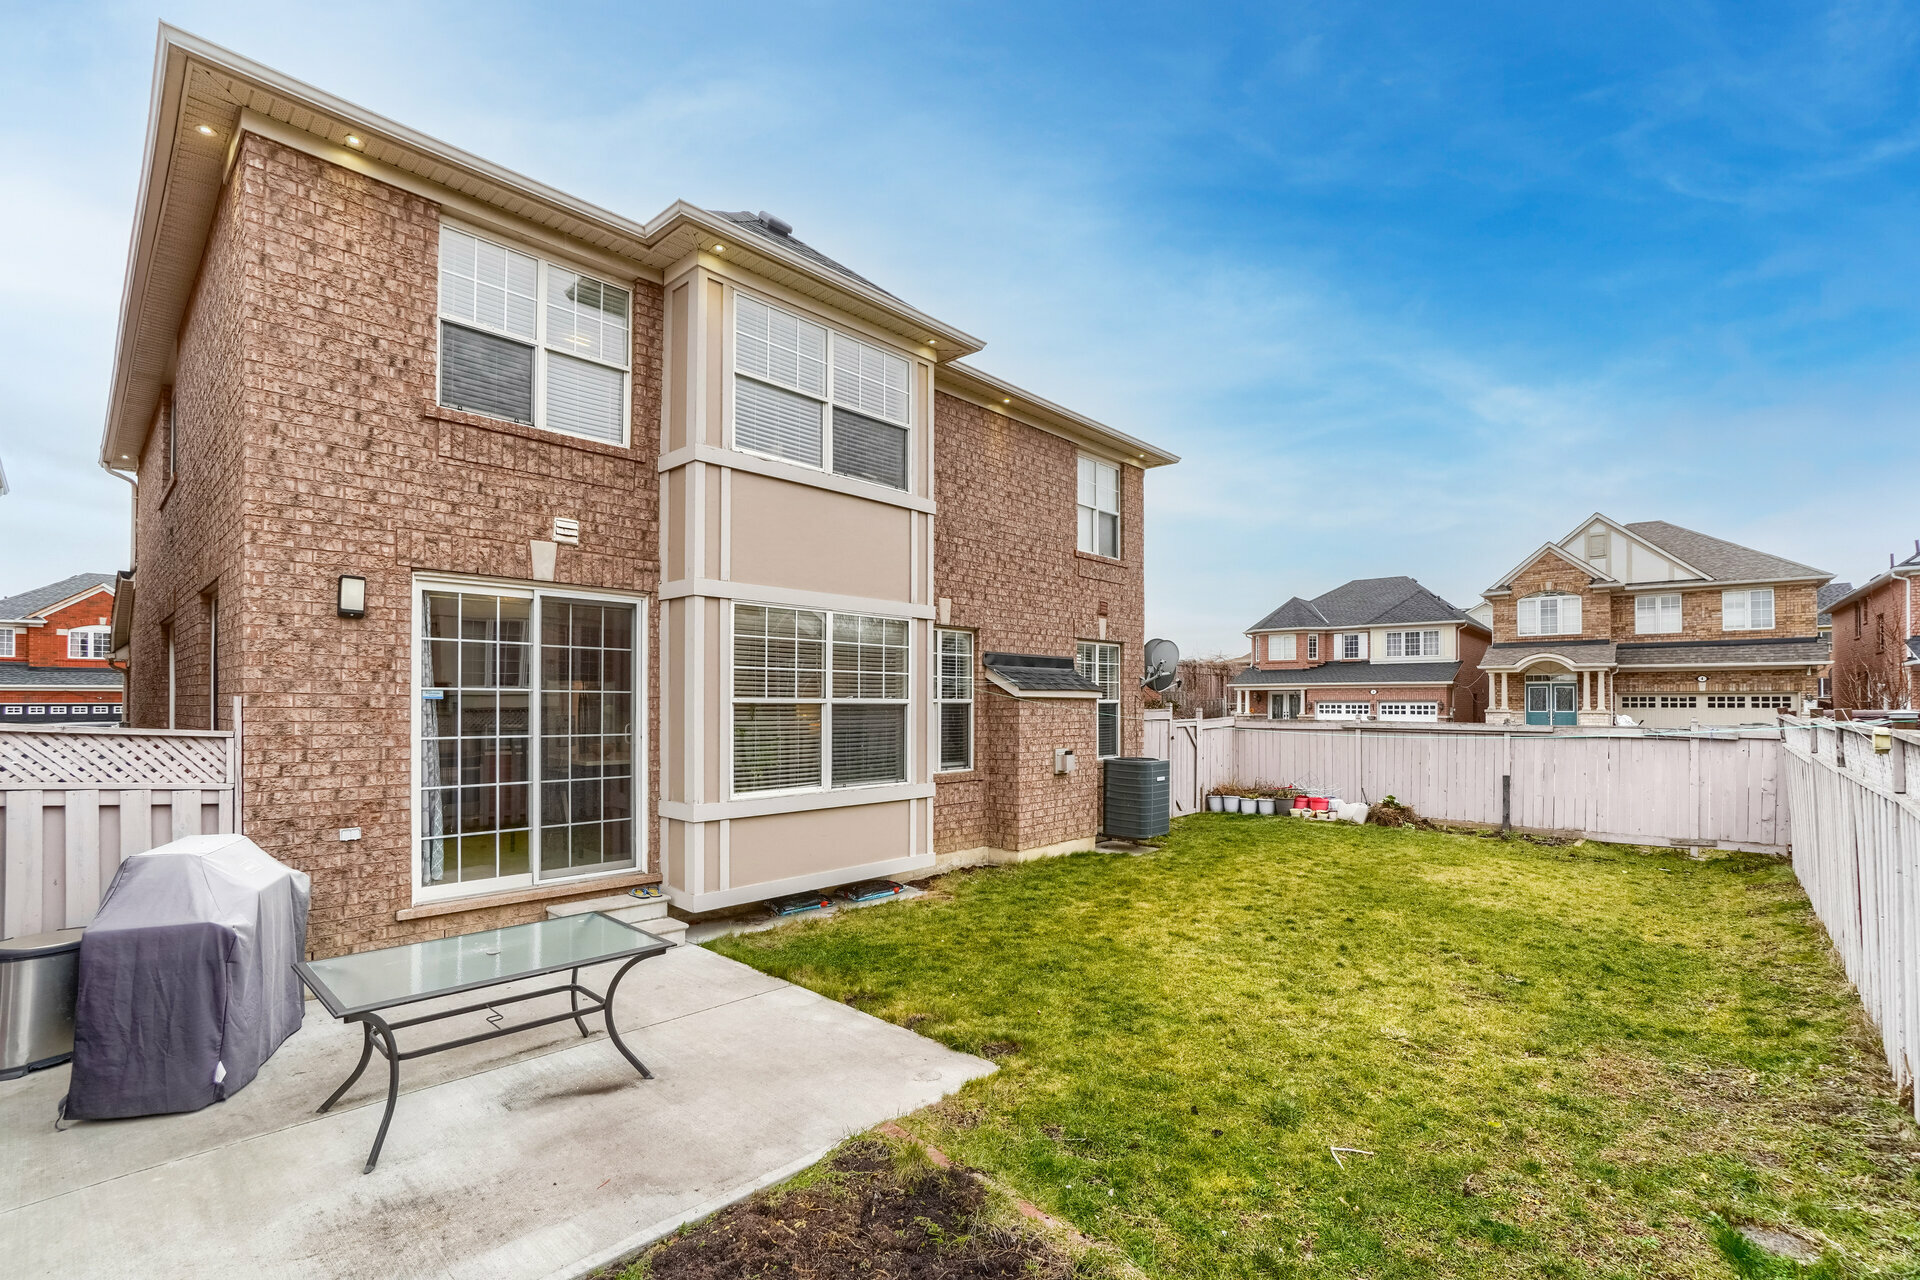
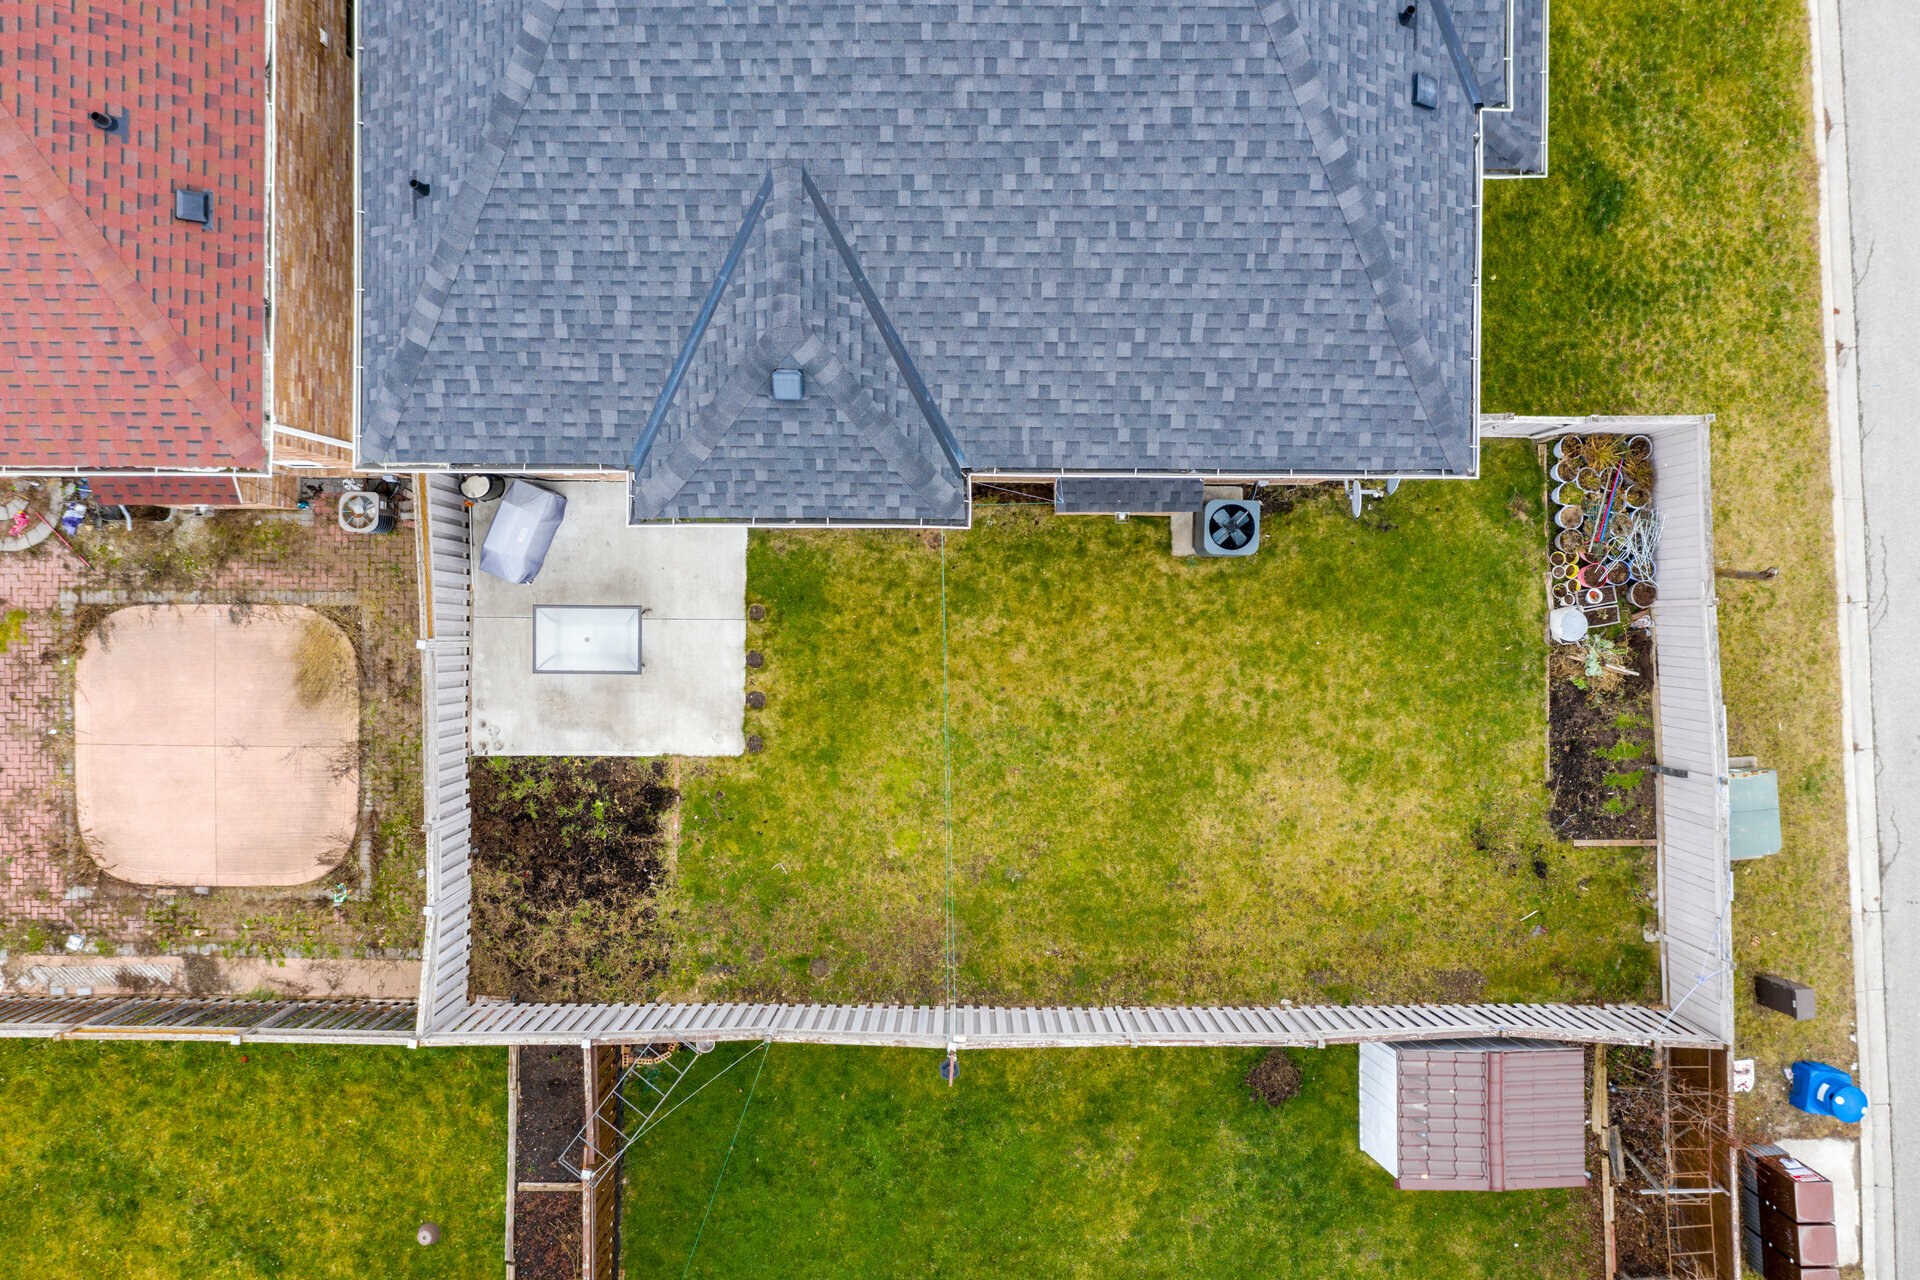
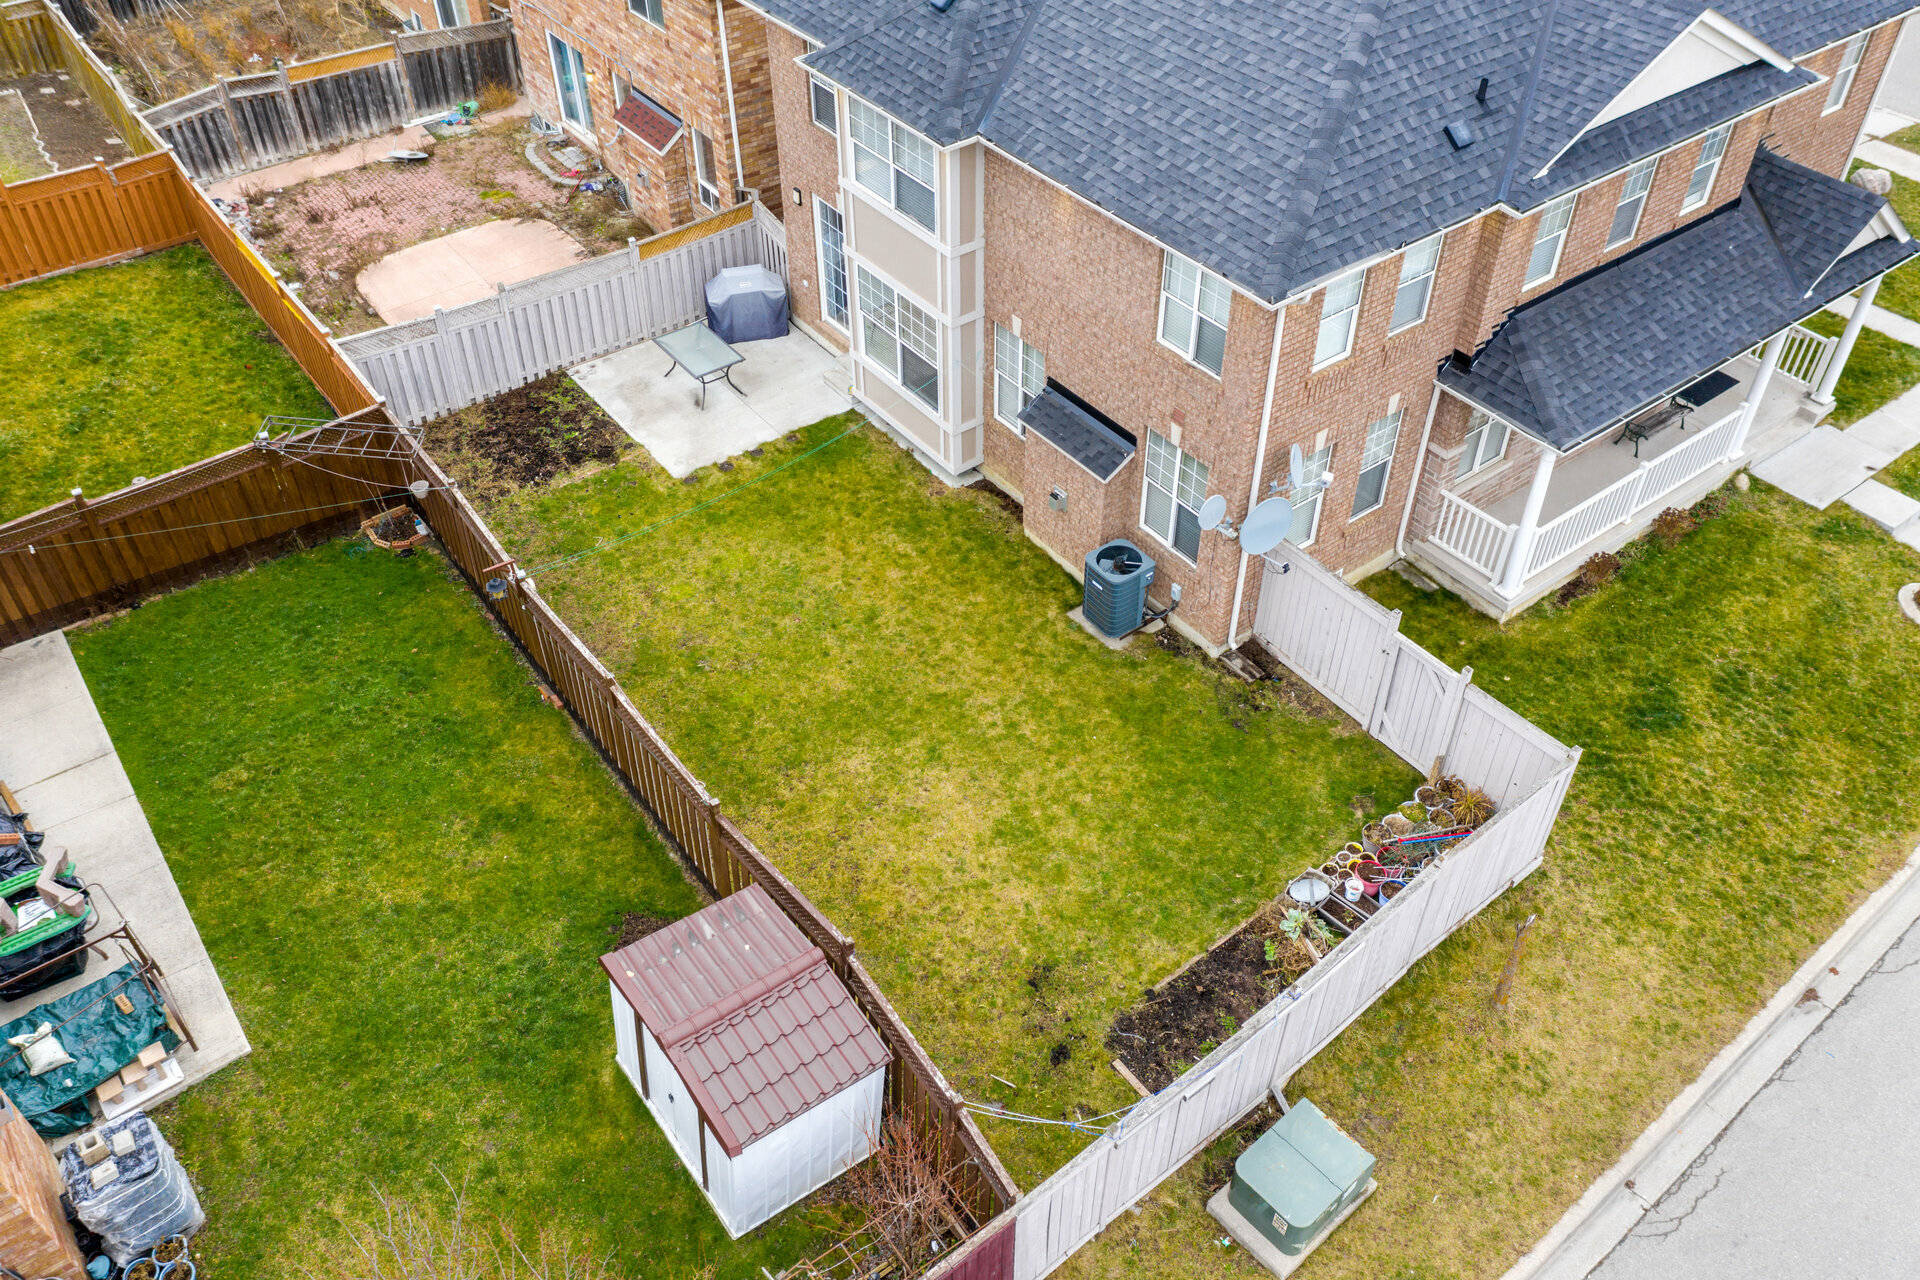
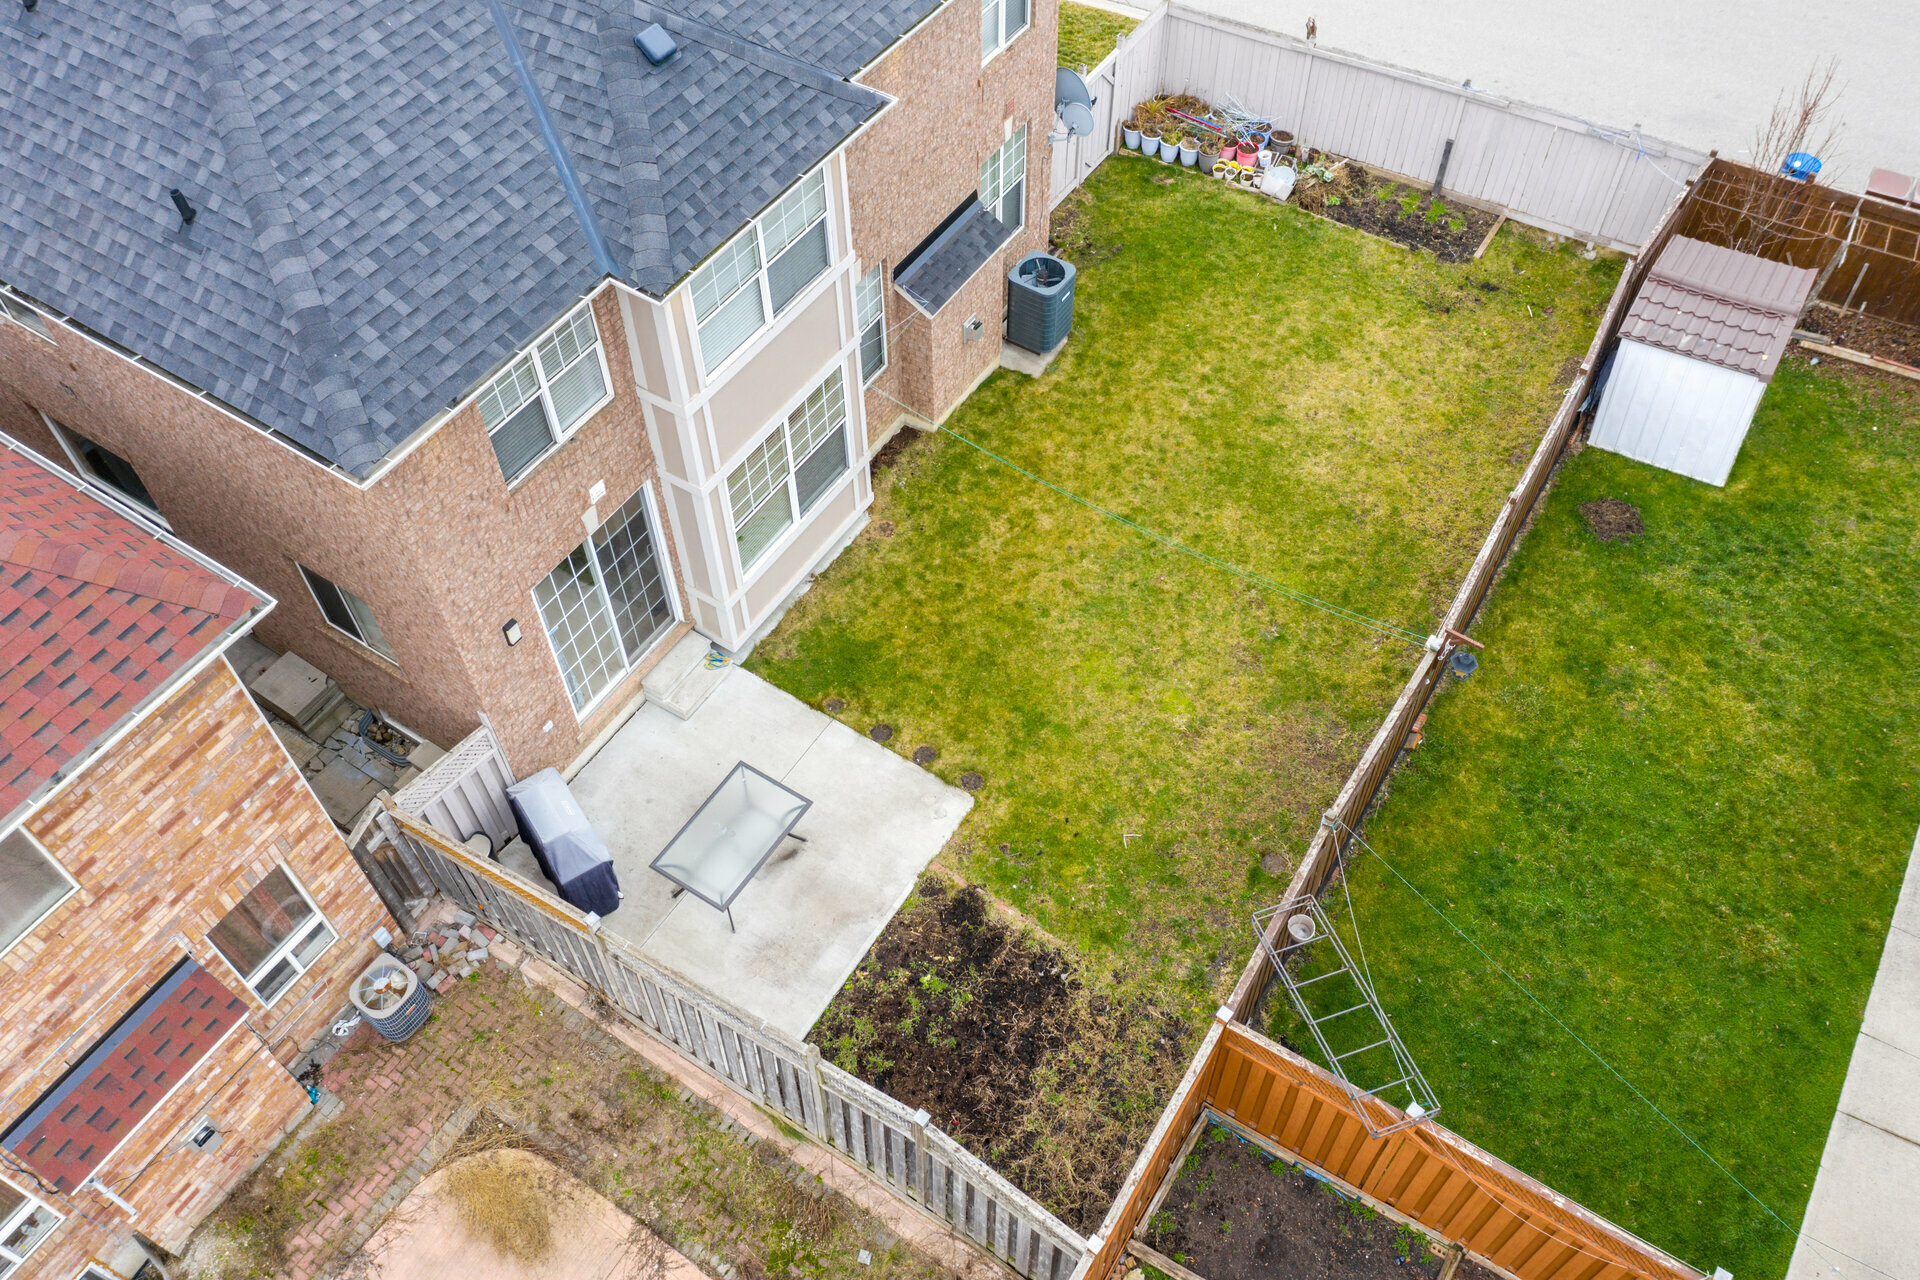
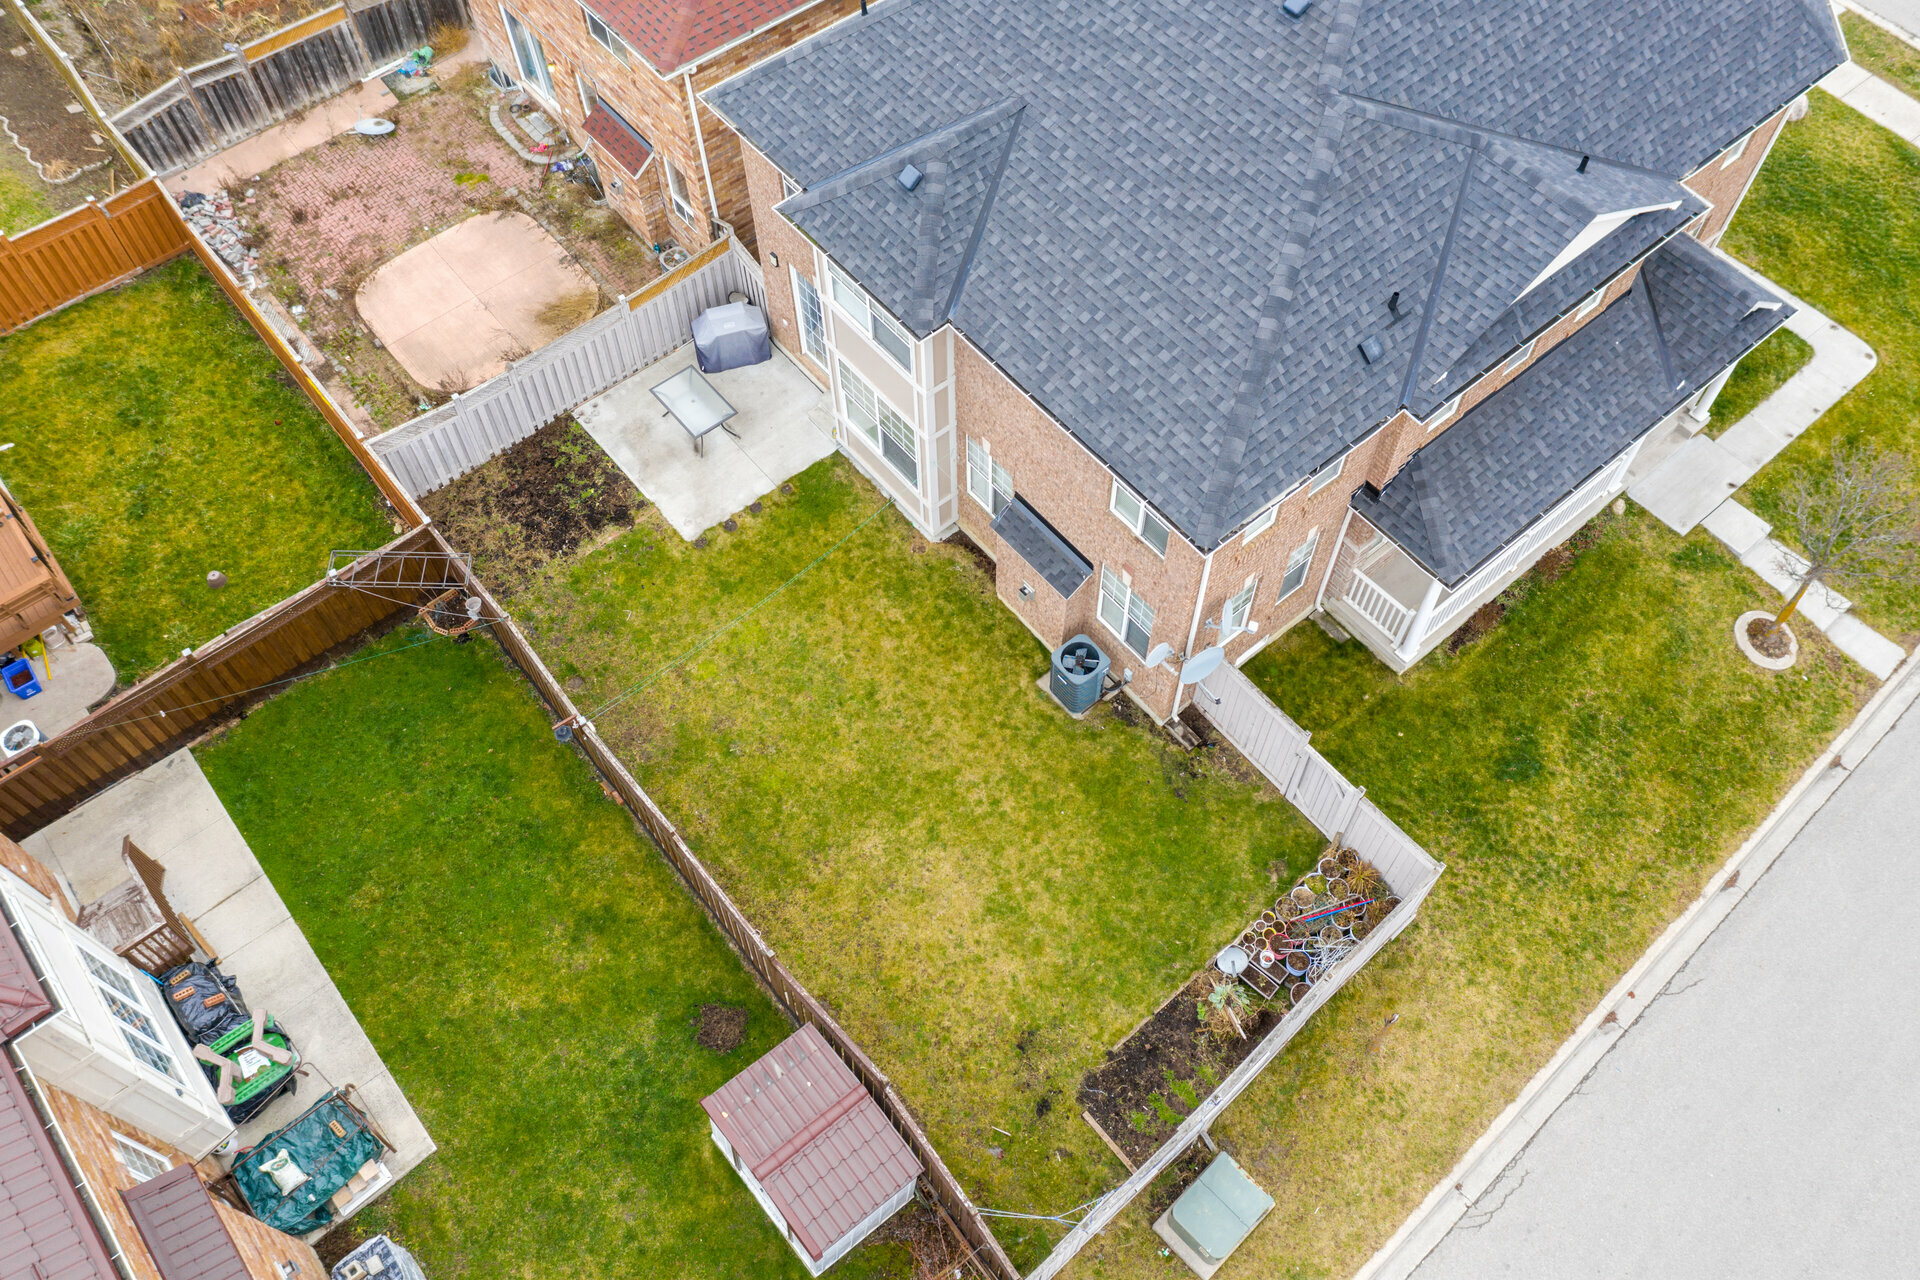
Photo Gallery
|

|
|
|
|
|
|

|
|
|
|
|
|
|
|
|
|
|
|
|
|
|
|
|
|
|
|
|
|
|
|

|
|

|

|
|

|
|
|
|
|
|
|
|

|
|

|
|
|
|
|
|
|
|
|
|
|
|
|
|
|
|
|
|
|
|
|
|

|
|
|
|
|
|
|
|
|
|
|
|
|
|
|
|
|
|
Demographics


Population by Age Group
Population Growth/Projection
Education
Marital Status
Languages
Household income
Children at Home
Ownership
Construction Date
Occupations
Mortgage calculator
powered by 
This calculator is for demonstration purposes only. We do not guarantee that all calculations are accurate. Always consult a professional financial advisor before making personal financial decisions.