Skip to the tour
Property tour

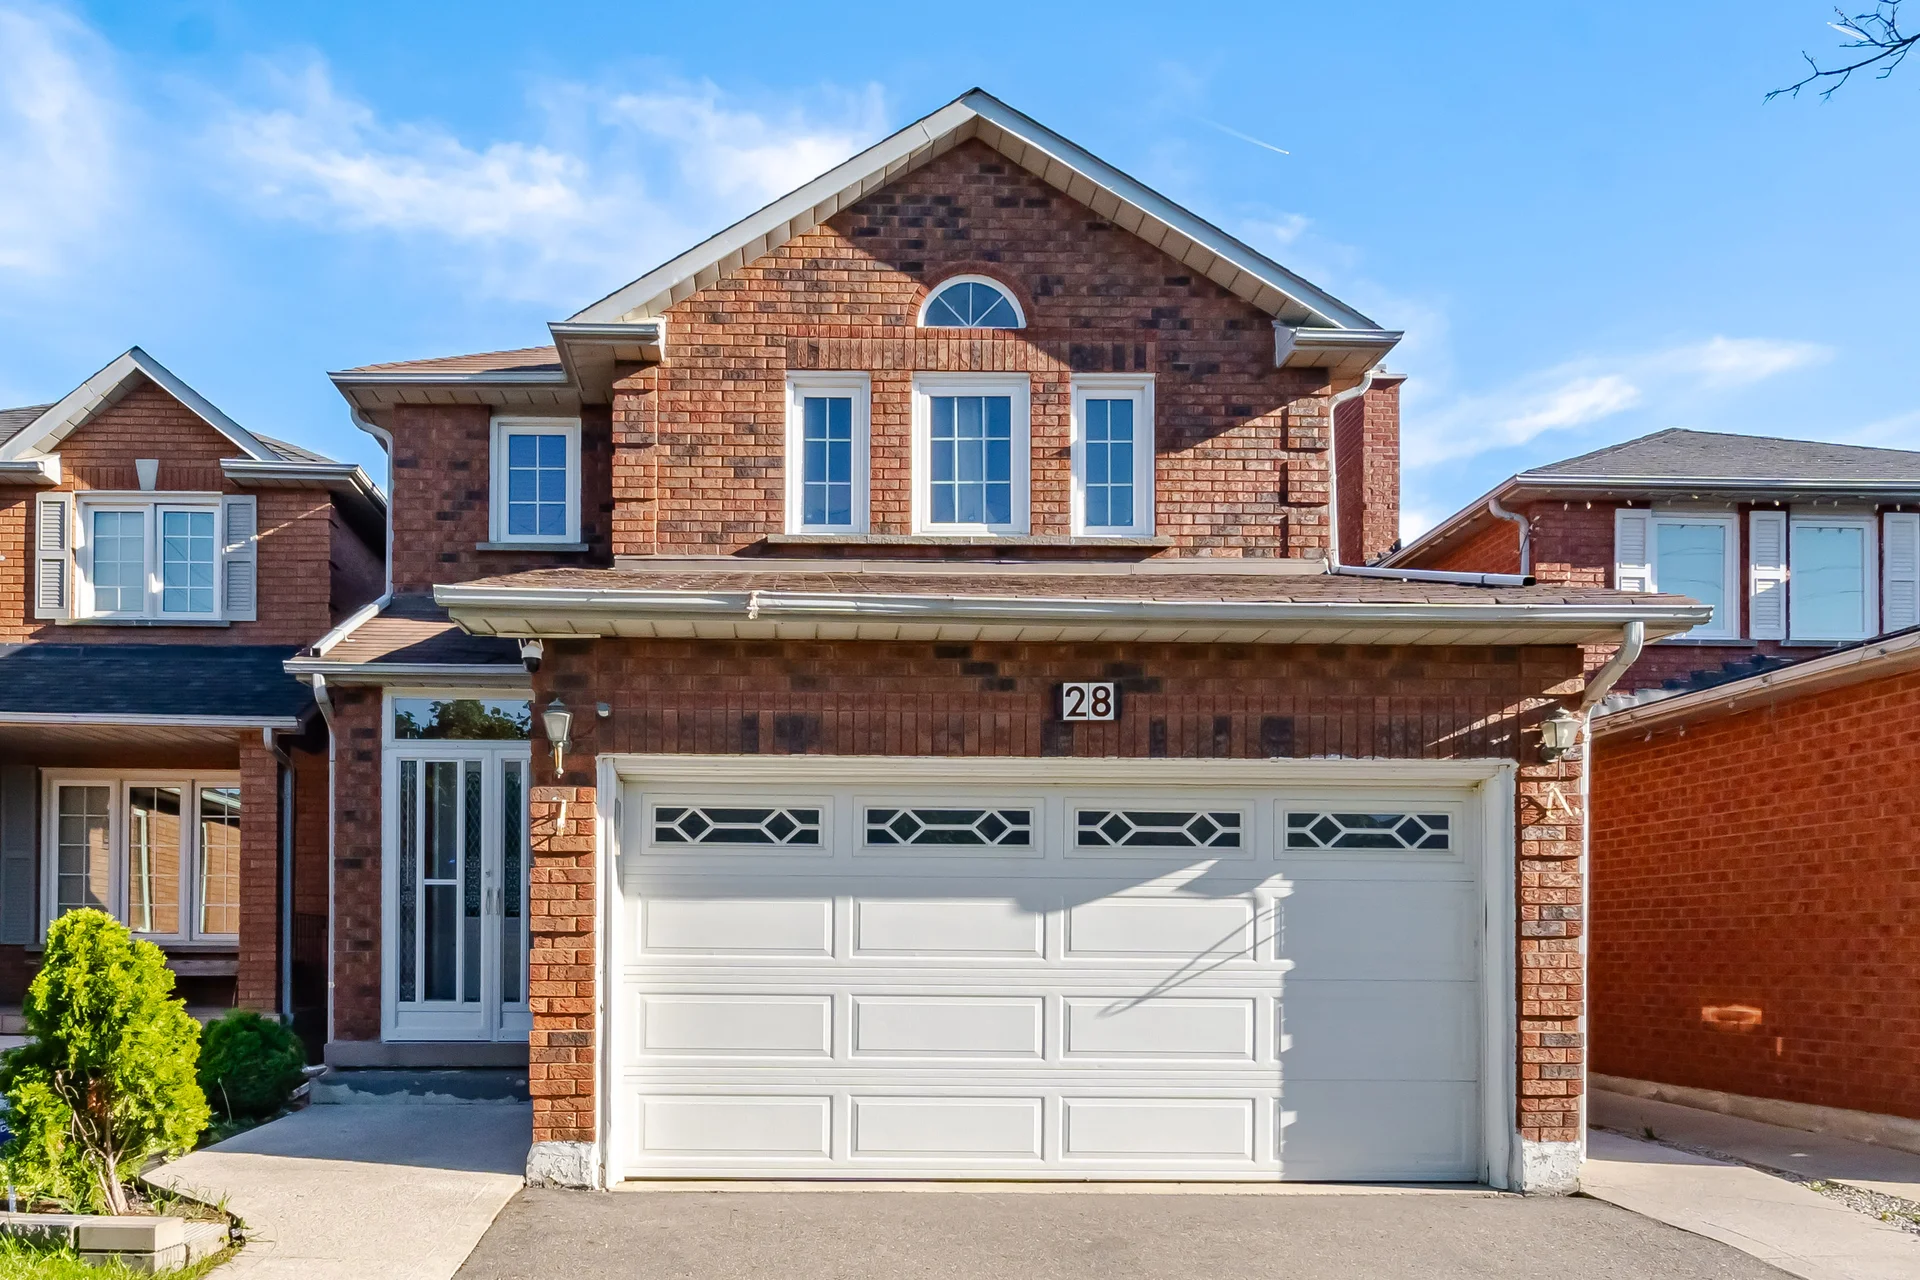
28 Pennsylvania Avenue

Brampton

Video tour

29 photos

What’s nearby

 Loading map…

Straight-line distances. Walking times are estimates at 5 km/h. Map data © OpenStreetMap contributors.

Who lives nearby

Population figures for the area around the home, outlined on the map.

 Loading map…

Population of the area

678 in 2023

Up 0.9% since 2013

Projected 693 by 2028

Population by Age Group

Population grouped according to age in the area containing the listing.

  • 0 - 4 years old6%41
  • 5 - 9 years old6%38
  • 10 - 19 years old10%69
  • 20 - 34 years old30%196
  • 35 - 49 years old19%123
  • 50 - 54 years old6%40
  • 55 - 64 years old13%84
  • 65 - 69 years old5%30
  • 70 - 79 years old4%28
  • 80 - 84 years old1%7
  • 85+ years old1%5

Population Growth/Projection

Past and expected changes in population.

Up 0.9% from 2013 to 2023

Education

Highest level of education from an accredited institution, based on evaluation rather than attendance.

  • No cert. / Diploma / Degree20%108
  • High school32%174
  • Apprenticeship / Trade cert. / Diploma2%10
  • Non-university cert. / Diploma17%92
  • University cert. / Diploma below bachelor8%41
  • University degree22%121

Marital Status

Marital or formal relationship statuses.

  • Married58%317
  • Common law1%6
  • Single34%183
  • Separated3%14
  • Divorced2%13
  • Widowed2%13

Languages

Self-identified first language or combination of languages spoken in the area.

  • Punjabi39%260
  • English34%225
  • English & Non-Official5%35
  • Urdu5%34
  • Vietnamese3%20
  • Tamil3%18
  • Hindi3%17
  • French2%11
  • Italian1%9
  • Other Languages5%30

Household income

The combined gross income of all the members of a household who are 15 years old and older. Individuals do not have to be related to be considered members of the same household.

  • $0 - $29,99911%18
  • $30,000 - $59,99921%35
  • $60,000 - $79,99919%31
  • $80,000 - $99,99922%36
  • $100,000 - $149,99925%41
  • $150,000 - $199,9993%5

Children at Home

Children at home includes: never married sons or daughters, previously married sons or daughters (alone); grandchildren with no parent present.

  • 0 - 4 years old15%39
  • 5 - 9 years old15%38
  • 10 - 14 years old13%33
  • 15 - 19 years old11%28
  • 20 - 24 years old28%70
  • 25+ years old18%45

Ownership

Those living spaces that are owned, rented.

  • Own73%121
  • Rent27%45

Construction Date

Ranges for the years in which properties in the area were built.

  • 1981 - 199030%49
  • 1991 - 200055%90
  • 2001 - 200515%24
  • After 20161%2

Occupations

Based on the total labour force, occupation is a grouping of similar job tasks and work performed.

  • Sales and service33%115
  • Business, Finance, Admin16%54
  • Not Applicable14%49
  • Trades, Transport, Operators13%46
  • Manufacture and Utilities12%43
  • Management7%24
  • Social Sciences, Education, Government, Religion2%6
  • Other3%10

Figures describe the area around the home, not the home itself.

How far you can get

 Loading map…

Areas reachable by car from the home.

Estimated travel times from OpenRouteService with typical road speeds, not live traffic. Select a time to show only that band.

Estimate your mortgage

$
%
%
Estimated monthly payment
–
Mortgage amount
–
Mortgage insurance (CMHC)
–
Total interest over the amortization
–

An estimate only, not a quote. Excludes property tax, condo fees and closing costs. Talk to a mortgage professional before you decide.

Share this tour